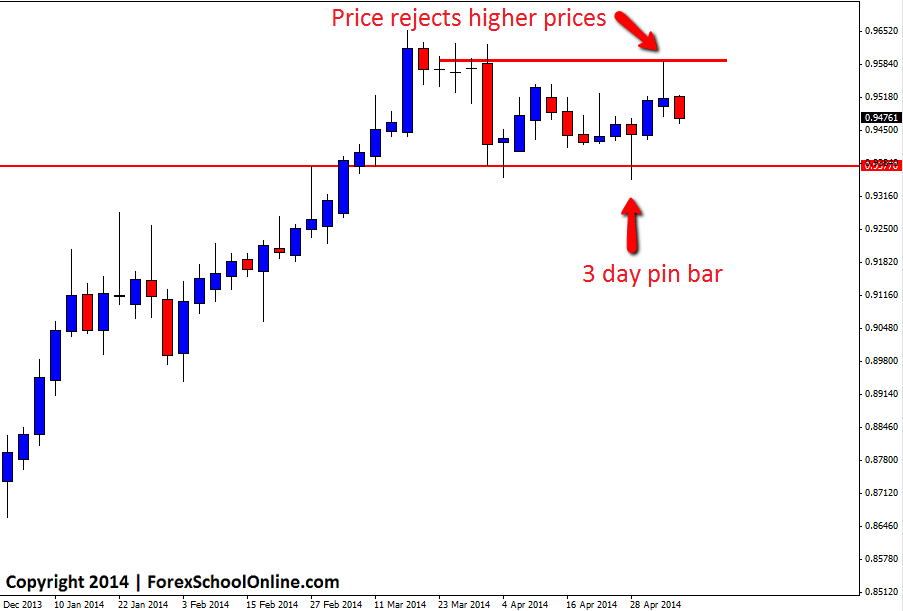
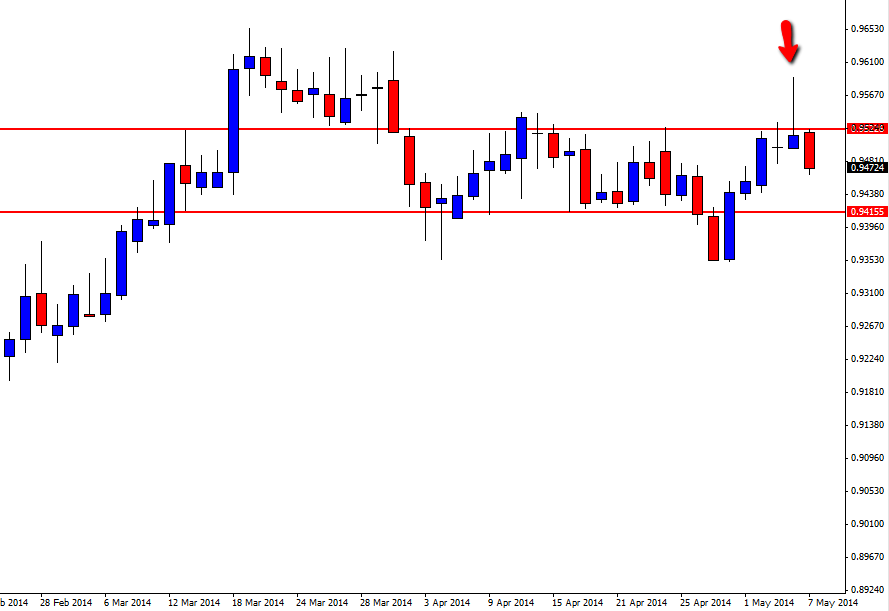
On the 1st of May we made a post in this blog about the 3 day pin bar that had formed on the NZDCAD chart. To read the original post see here: NZDCAD Fires Off 3 Day Pin Bar. After taking time to break the pin bars high and confirm the setup, once price broke higher, it quickly gained momentum and moved into the first near term resistance area we spoke about in the original blog post of 0.9520. Price then burst up and on higher, but has now rejected higher prices, forming a bearish pin bar on the daily price action chart which is shown on the second chart below.
After being in a solid trend higher, price is now caught trading in a large sideways box. These can be very tricky to trade because they do not have a clear trend either way and can be filled with traffic and pockets of minor support and resistance areas that traders need to watch out for.
If this daily pin bar moves lower it is trading straight back into one of these traffic areas just discussed. If price can gain momentum and break through the traffic, the next major support comes in at the low of the boxing area around the 0.9415 on the daily chart.
If you want to change your MT4 charts so that you can make any time frame chart you want like the 2hr chart below, read here: MT4 Change Time Frame Indicator
NZDCAD 3 Day Chart

NZDCAD Daily Chart


both the charts are same.
Thanks Aravindh.