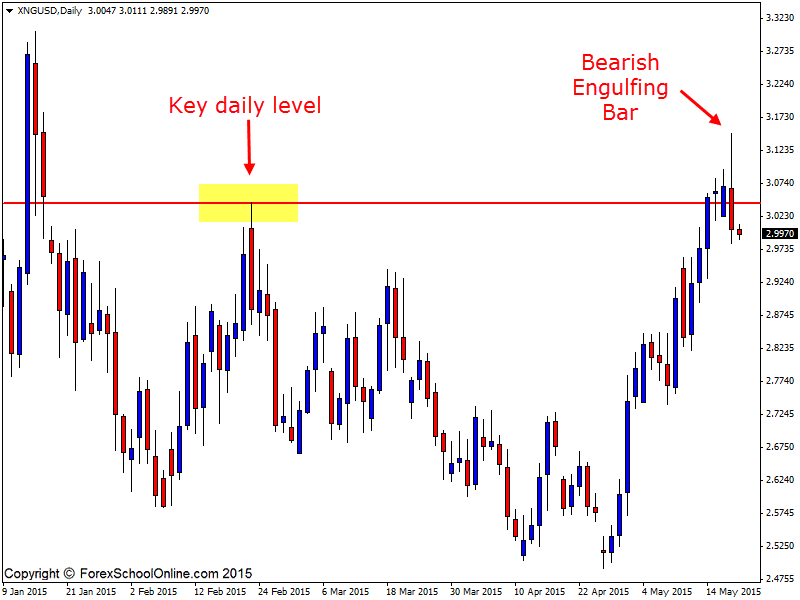
The Natural Gas or XNGUSD daily price action chart has formed a Bearish Engulfing Bar (BEEB) engulfing the previous two candles. This engulfing bar has formed after a large run higher in recent times with price having made a steep climb off a double low.
As the daily chart shows below; price was down at extreme lows before forming a base and double low. It was this final test of the support and double low that gave price the order flow needed to start the turn around back higher.
Price has now formed the BEEB against this recent move higher and up at a swing high rejecting a daily resistance level. If price can break lower and confirm the the engulfing bar, the near term support comes in around the 2.9500 area.
From there if price can break lower, the 2.8880 area could be the next area of support for price to move into.
SPECIAL NOTE: The two winners have now been announced for the WIN a Forex Tester 2 Back-testing License! Congratulations to Daniel M and Sulaiman and thank you so much to all of you who took part and entered this competition. Make sure you keep an eye out for our next competition and what our next cool prize will be.
NAT GAS v USD Daily Chart


Hi Eric,
you can read about the broker we recommend, what should be looking for in a broker & why you need to use the correct New York close charts here; https://www.forexschoolonline.com//recommended-forex-broker-charts-price-action-traders/
Yes we trade and our charts have commodities as well as other markets such as major stock indices.
If you have any other questions either just make a comment or send me an email.
Safe trading,
Johnathon
Hi, what broker do you use to trade? I’m guessing you use one with decent swap rates and one that includes commodities. Would be much appreciated!