Mid-Week Price Action Trade Ideas – 22nd May 2019
Markets Discussed in Today’s Trade Ideas: EURUSD, AUDCAD and OIL.
Note: We Use Correct ‘New York Close 5 Day Charts’ – You can read about why we use these and how to download the correct free charts at Correct Free New York Close Demo Charts
EURUSD Daily Chart
Big Test of Major Support Looming
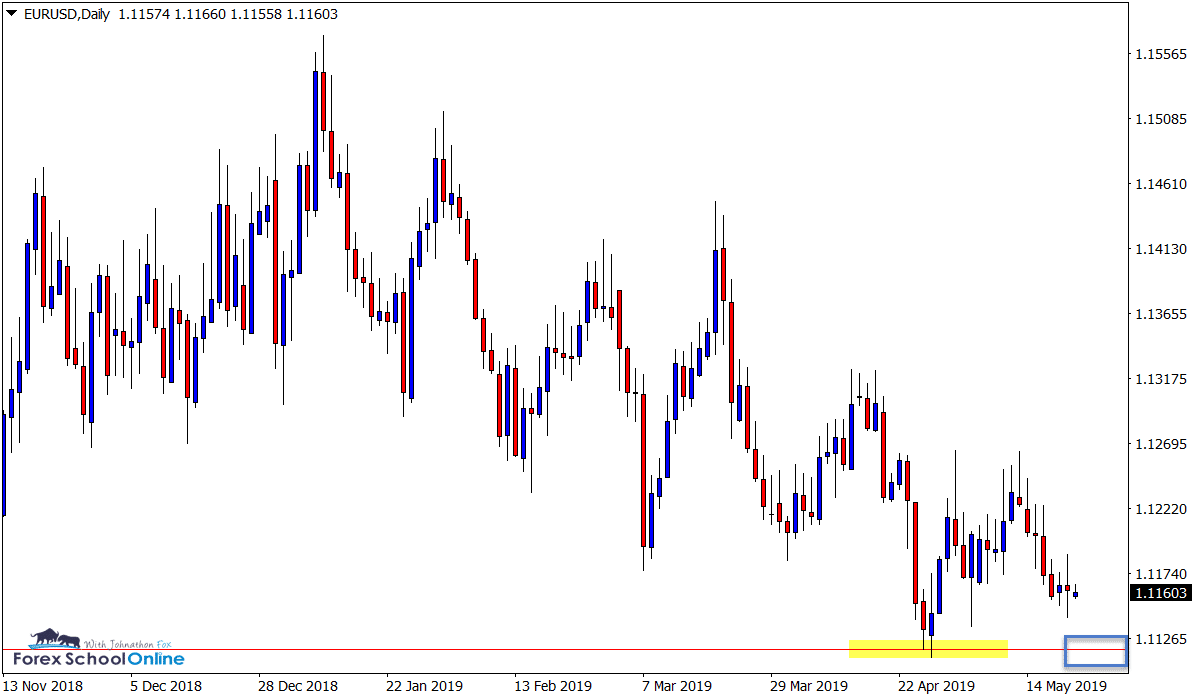
Price action on the daily chart is creeping lower and looking to make another potential test of the major daily support level.
In recent times the momentum has been lower with multiple lower highs on the daily chart. The last re-test of the daily swing high also failed to see price make a new high and a bearish pin bar has since sent price lower.
Whilst the momentum has been lower I will be watching the major daily support for any signs of bullish price action and if the bulls are looking to hold this level. This level looks to be crucial as it is a long term support and if it does give way, then a fast break lower into space could be on the cards.
Daily Chart
AUDCAD Daily and 1 Hour Charts
Next Support Ahead After Pin Bar
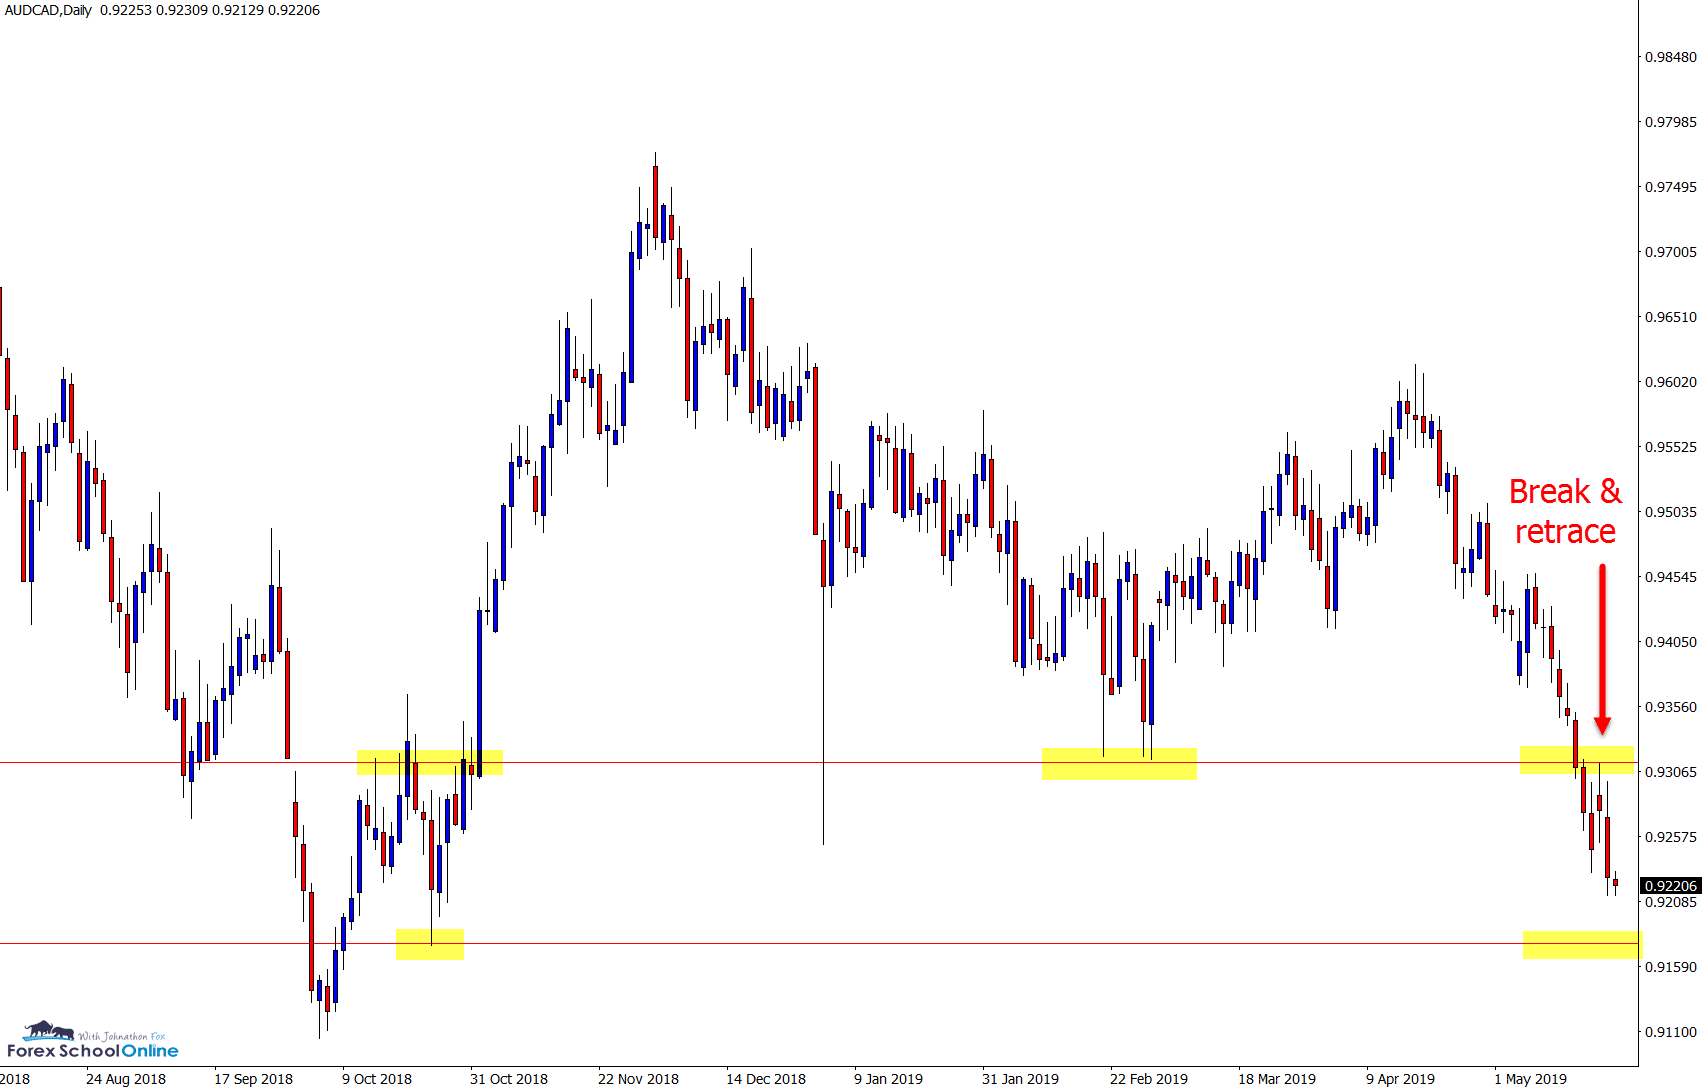
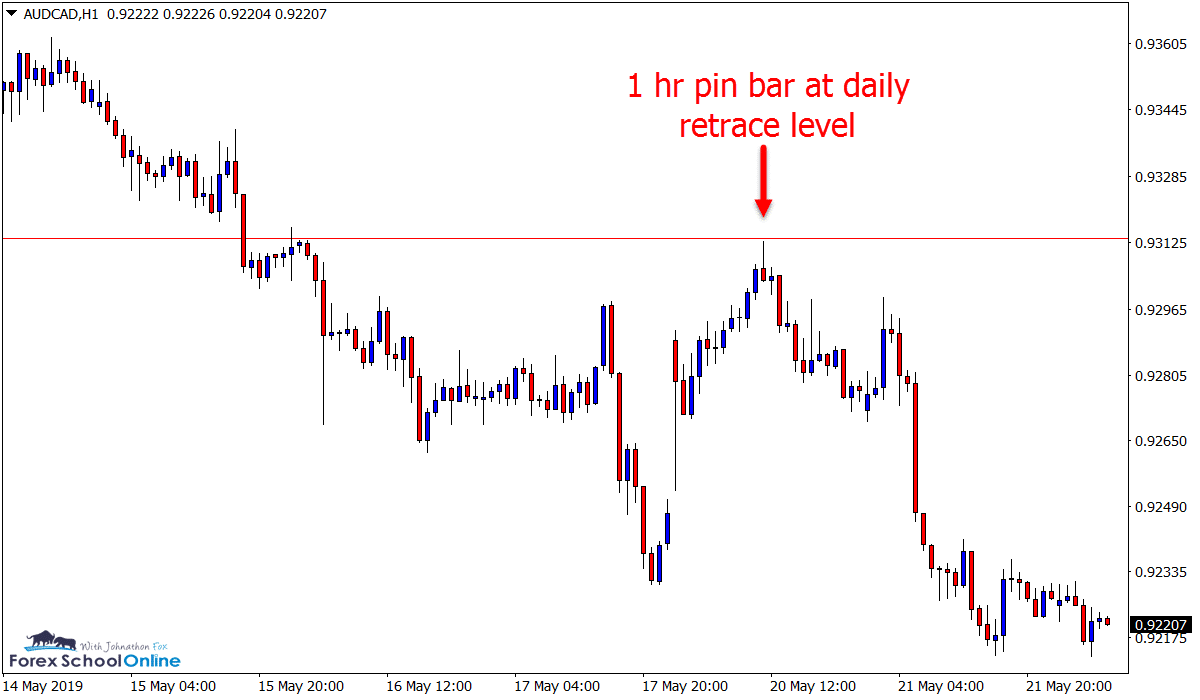
In the start of week trade ideas we were looking at this market and for price to make a potential retrace back into the overhead breakout price flip resistance level.
Price has since made a quick retrace, fired off a 1 hour bearish pin bar reversal and is now moving back lower.
This has been a strong and extended move lower so the next major support looks to be an interesting watch.
Daily Chart
1 Hour Chart
OIL Daily Chart
Stuck Between Daily Support and Resistance
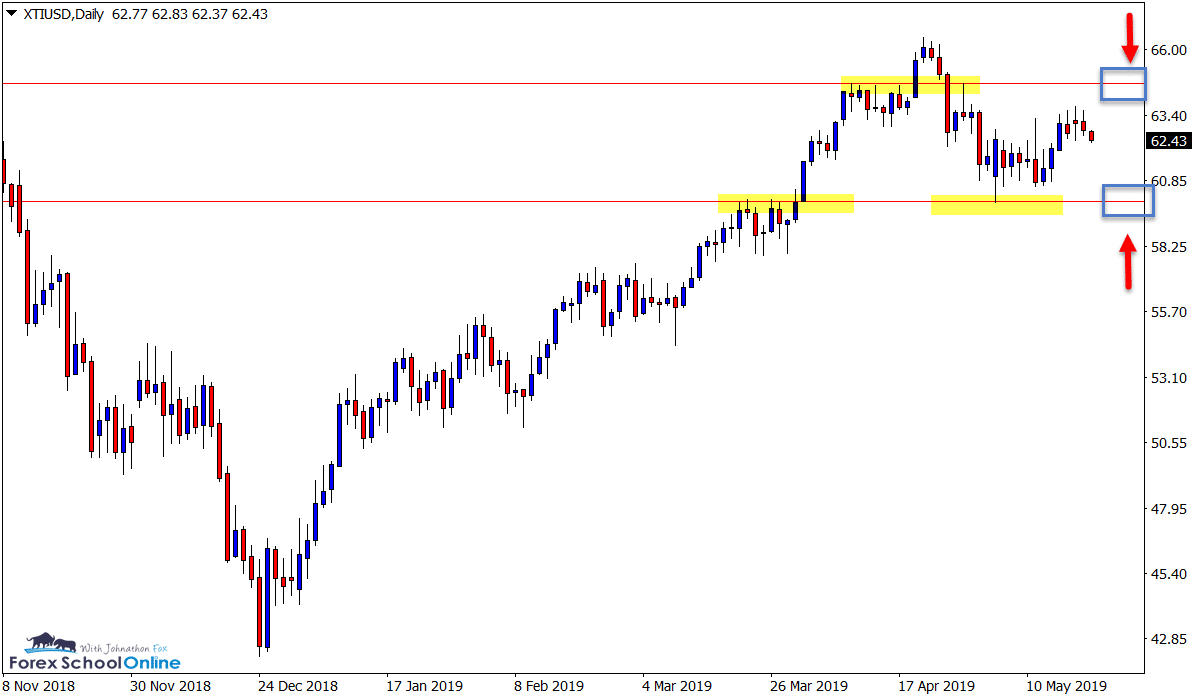
Price action on the daily chart of Oil is stuck between two major support and resistance levels.
Whilst price had been in a trend higher for some time, we can see on the daily chart price has flipped below an important resistance and has been consolidating moving sideways.
Both the support and resistance levels look solid areas to watch for high probability reversal triggers over the coming sessions.
On the flip side, if price is able to make a move higher and breakout and try to continue the trend, traders could look for quick breakout and re-test trades similar to the setup just discussed on the AUDCAD above.
Daily Chart
Trade Ideas Note: All views, discussions and posts in the ‘trade ideas’ are the view of Forex School Online and are not recommendations or trading advice. All posts are general in nature and are not advice to buy or sell.
Please leave questions or comments in the comments section below;


Thank you
👍👍
Hi Johnathon,
Thanks your analysis. I compared my charts with yours and notice that my broker´s chart for AU/CD daily shows a massive spike down on 3rd Jan (fat finger/new year hangover?) which does not appear on your chart. The pin is over 350 pips! I wonder how this happens and if this is only on my broker´s chart.
Your thoughts.
Hi Gavrick,
this mini crash and false break happened on most AUD pairs at start of year.
This large false break candle is also on the AUDCAD daily and on chart above is penetrating below the support and snapping back above.
If this looks different, please make sure using NY close charts; https://www.forexschoolonline.com//recommended-forex-broker-charts-price-action-traders/
Anything else let me know,
Johnathon