Lucky Block Price Prediction- October 1
The market price of LBLOCKUSD may resume its upside moves soon. Based on the outlook, should the daily candlestick closes above the $0.0004412 supply mark, the correction phase will extend to meet the resistance at the $0.02000 trend line.
Key Levels:
Resistance levels: $0.004500, $0.004600, $0.004700
Support levels: $0.0003900, $0.0003800, $0.0003700 LBLOCKUSD Long-term Trend: Bullish (1H Chart)
LBLOCKUSD indicates an upward trend with a bullish sentiment in its long-term perspective. The coin is trading above the two EMAs. However, the market is presently facing resistance at the recent high.
Earlier today, the bull run caused a rise in the price of Lucky Block to a high at the $0.0004171 level after which the sell traders returned the price to a low at the $0.0004126 support level above the moving averages.
This current trend will enable the price to remain on the upside and rise or break out to the upside. This however creates a strong area of interest for the buyers.
Hence, with the price pointing upwards on the daily stochastic means that further upside is certain. It is therefore expected that the buy investors will move the price action up and may likely hit the $0.02000 supply level soon in its higher time frame.
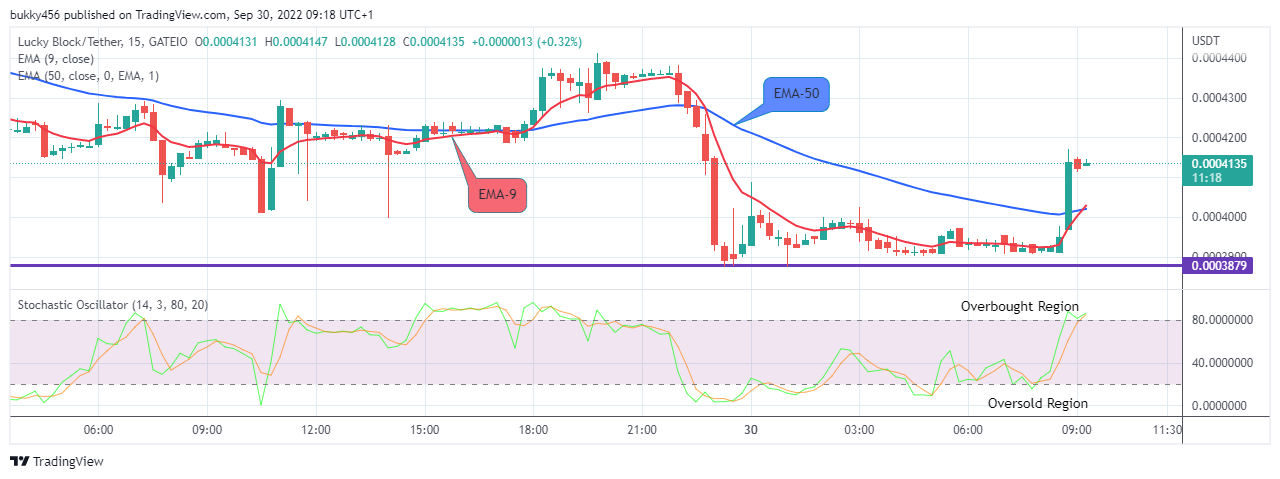
LBLOCKUSD Short-term Trend: Bullish (15-Minute Chart) The market price of LBLOCKUSD which increases from $0.0003976 to the $0.0004171 high level above the moving averages suggests an uptrend in the context of the strength of the market. Thus, closing the 15-minute session above the $0.0004381 will put the trade more on the buy side.
Hence, the pair pointing up on the daily stochastic means that the buying pressure may continue, and suggests a possible recovery of the $0.02000 supply level in the coming days in the lower time frame.
You can purchase Lucky Block here. Buy LBLOCK
Learn to Trade Forex Online
Lucky Block Price Prediction: LBLOCKUSD to Swing up, Breakout Imminent
Footer

ForexSchoolOnline.com helps individual traders learn how to trade the Forex market
WARNING: The content on this site should not be considered investment advice and we are not authorised to provide investment advice. Nothing on this website is an endorsement or recommendation of a particular trading strategy or investment decision. The information on this website is general in nature so you must consider the information in light of your objectives, financial situation and needs.
Investing is speculative. When investing your capital is at risk. This site is not intended for use in jurisdictions in which the trading or investments described are prohibited and should only be used by such persons and in such ways as are legally permitted. Your investment may not qualify for investor protection in your country or state of residence, so please conduct your own due diligence or obtain advice where necessary. This website is free for you to use but we may receive a commission from the companies we feature on this site.
We Introduce people to the world of currency trading. and provide educational content to help them learn how to become profitable traders. we're also a community of traders that support each other on our daily trading journey
Forexschoolonline.com is not a financial advisor. Do your research before investing your funds in any financial asset or presented product or event. We are not responsible for your investing results.

Leave a Reply