Lucky Block Price Prediction- September 6
The market price of LBLOCKUSD may resume its upside moves soon. Base on the outlook, if the resistance level rises above the $0.002399 value, continuation to the upside is ensured.
Key Levels:
Resistance levels: $0.001500, $0.001600, $0.001700
Support levels: $0.000884, $0.000784, $0.000684 LBLOCKUSD Long-term Trend: Bearish (4H Chart)
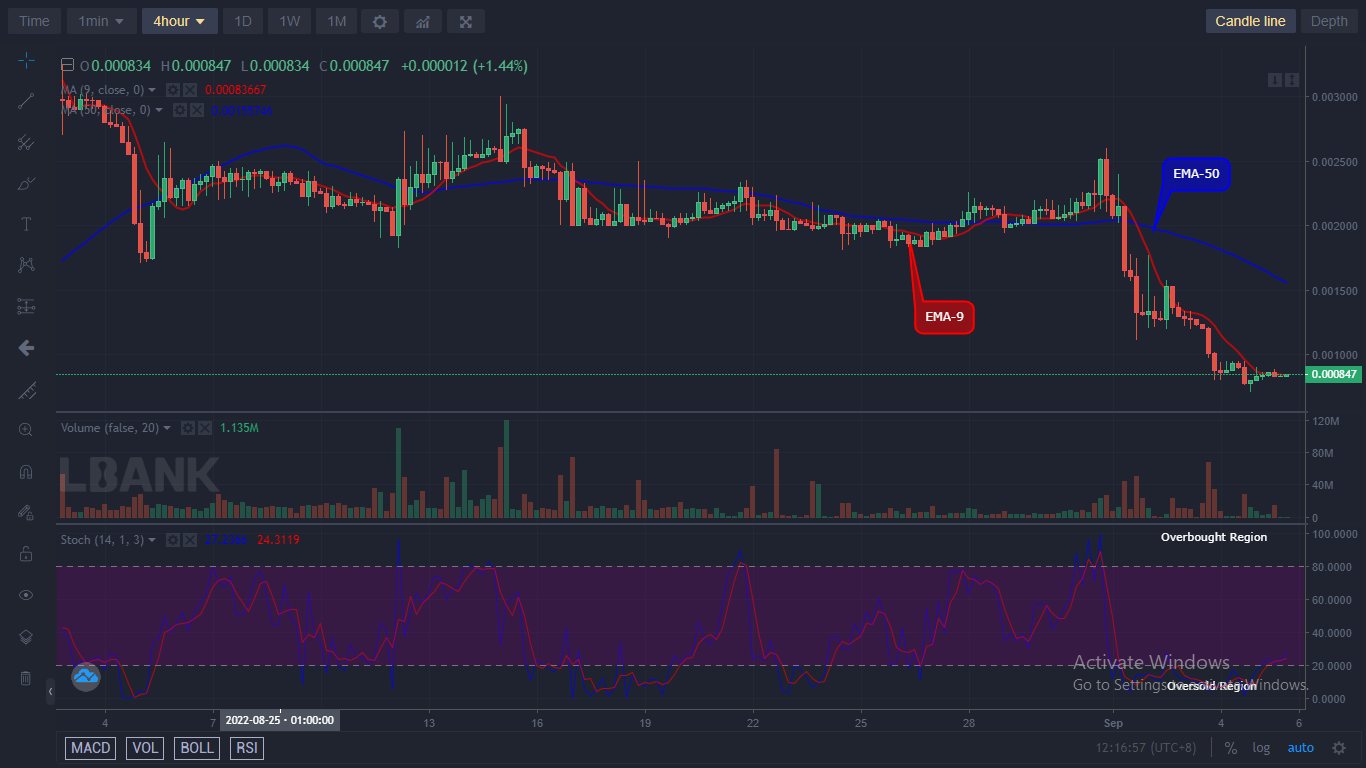
Lucky Block is possibly making its way up after hitting $0.000831level to overcome resistance to signal a pump up. It looks like price will want to bounce up again in the long-term.
The cryptocurrency has completed his correction and now set for an upswing. The bulls have decided to shift the trend up after series of lows shortly after today’s 4-hourly chart opens. The pullback at the $0.000867 resistance level suggests the returns of the buy traders in the market. Traders are advised to use the opportunity to invest in the coin and make more gains.
Further, the momentum indicator shows that the price signal is also moving upward in the market as we expect the price distribution to reach a $0.2000 high level soon as we watch the market turns bullish in the long-term perspective.
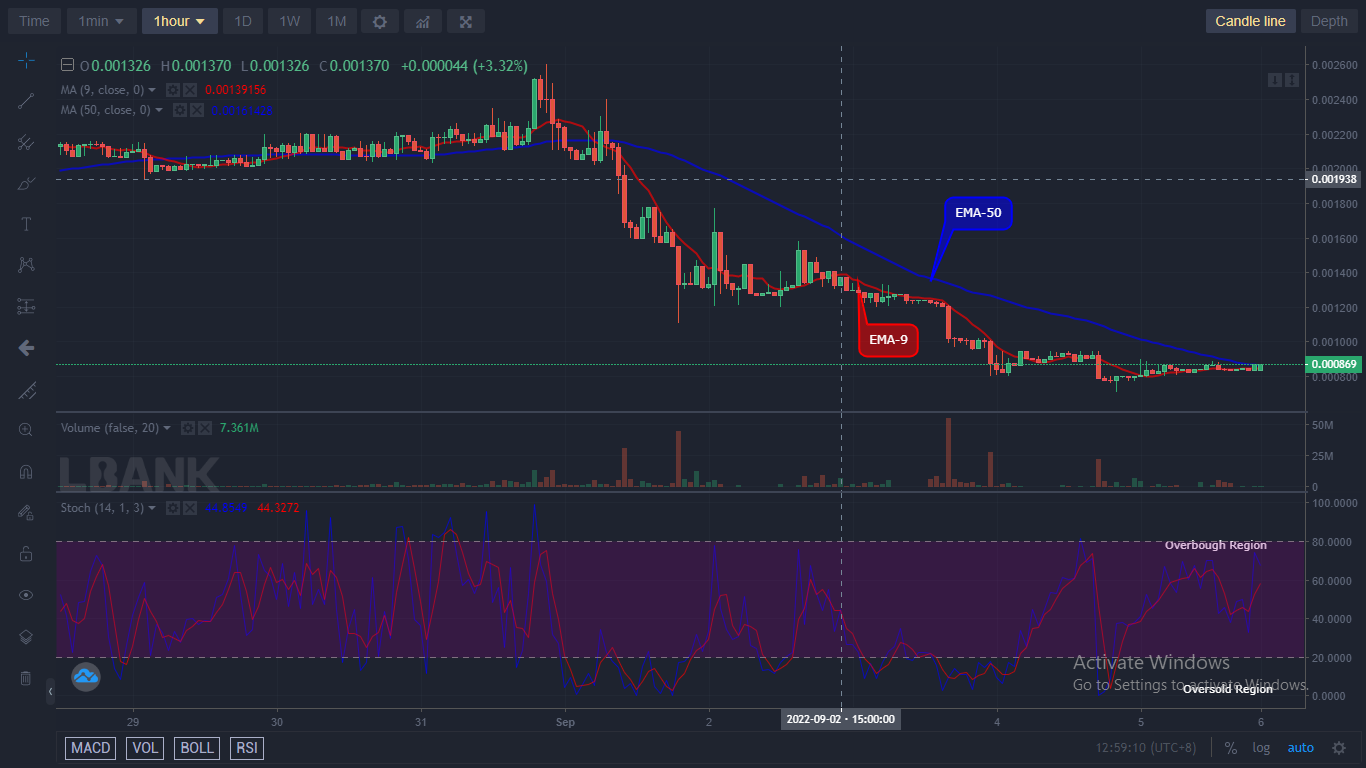
LBLOCK/USD Medium-term Trend: Bullish (1H Chart) The market price of LBLOCKUSD which increases to a $0.000869 high level above the moving averages suggests an uptrend in the context of the strength of the market. Closing the 1-hourly session above the $0.002000 will put the trade more on the buy side.
Hence, the pair pointing up on the daily stochastic means that the buying pressure may continue, and suggests a possible recovery of $0.2000 supply level in the coming days in the lower time frame.
You can purchase Lucky Block here. Buy LBLOCK
Learn to Trade Forex Online
Lucky Block Price Prediction: LBLOCKUSD to Swing up, Breakout Imminent
Footer

ForexSchoolOnline.com helps individual traders learn how to trade the Forex market
WARNING: The content on this site should not be considered investment advice and we are not authorised to provide investment advice. Nothing on this website is an endorsement or recommendation of a particular trading strategy or investment decision. The information on this website is general in nature so you must consider the information in light of your objectives, financial situation and needs.
Investing is speculative. When investing your capital is at risk. This site is not intended for use in jurisdictions in which the trading or investments described are prohibited and should only be used by such persons and in such ways as are legally permitted. Your investment may not qualify for investor protection in your country or state of residence, so please conduct your own due diligence or obtain advice where necessary. This website is free for you to use but we may receive a commission from the companies we feature on this site.
We Introduce people to the world of currency trading. and provide educational content to help them learn how to become profitable traders. we're also a community of traders that support each other on our daily trading journey
Forexschoolonline.com is not a financial advisor. Do your research before investing your funds in any financial asset or presented product or event. We are not responsible for your investing results.

Leave a Reply