Lucky Block Price Prediction – August 19
It is actually time for the LBLOCKUSD to break out from the support level again. The coin market after completing the downward forces is set for another growth and from the look of it, it will keep growing. The bull race may likely continue all the way into the key psychological level of $0.0000885 supply value and beyond before we see any signs of buying slow down if the buy traders should put more aggression into the market.
Levels:
Resistance levels: $0.0000300, $0.0000400, $0.0000500
Support levels: $0.0000150, $0.0000140, $0.0000130
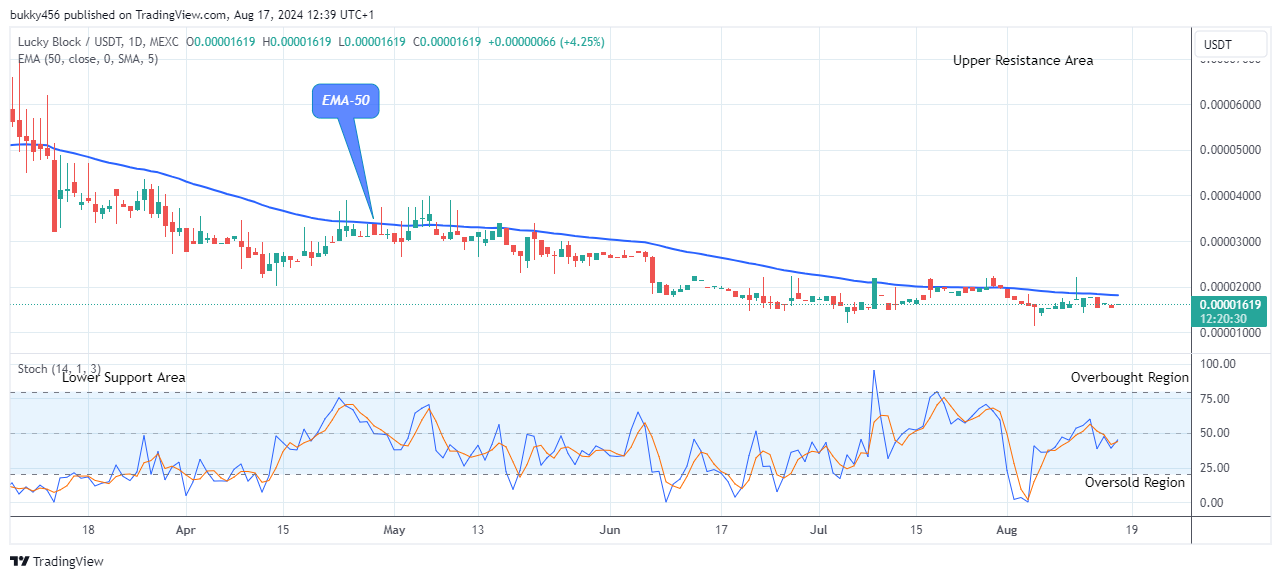
LBLOCKUSD Long-term Trend: Bearish (Daily Chart)
The Lucky Block pair has decided to break out from the support level as it began the new correction in its long-term outlook. The coin price has been below the supply trend levels since its most recent low due to the persistent bearish pressure over the last few days. However, this will soon be invalidated as the trend has just resumed its rising pattern to break out from the support level.
The LBLOCKUSD price movement to a $0.0000161 high level below the EMA-50 as the daily chart commences today is a pullback, suggesting that the bulls are ready to break out of the support level.
The sudden jump in Lucky Block price projects a potential challenge to the resistance trend line. A significant bullish crossover above the previous high of $0.0000885 moving signal line projects a buy signal.
Next, the Lucky Block pair can break out from the support level and grow further, as indicated by the daily signal indicating an uptrend. In light of this, the coin price might break out from support and grow higher to reach the $0.0001200 supply value in the coming days in its long-term outlook.
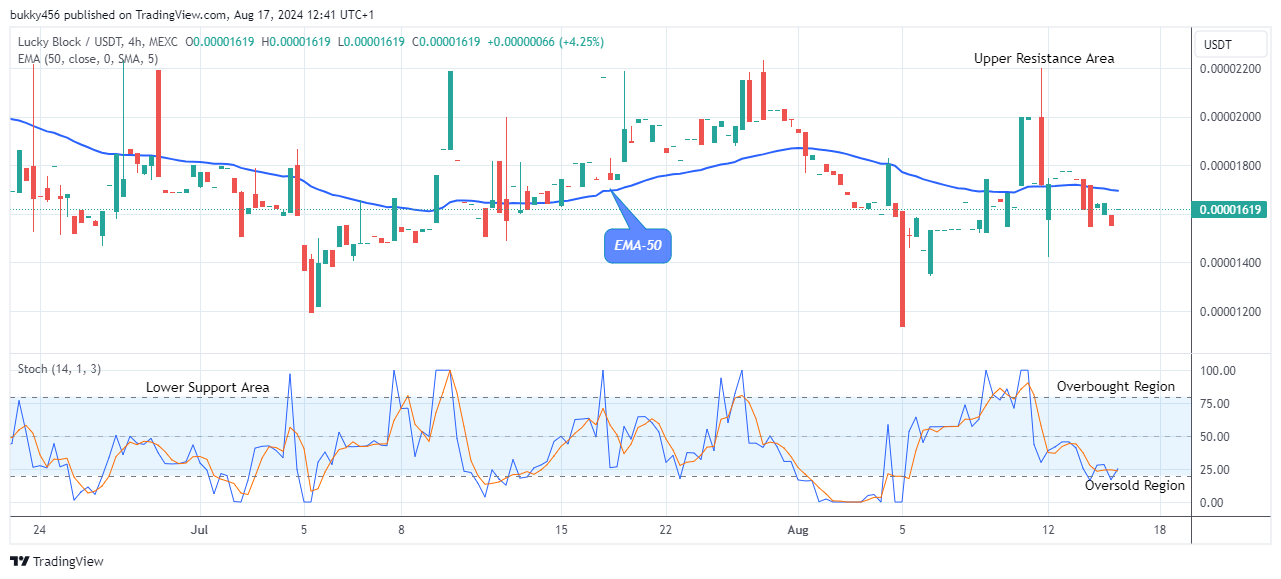
LBLOCKUSD Medium-term Trend: Bearish (4H Chart)
The LBLOCKUSD market is set to break out from the support as it faces a resistance level on the medium-term outlook. The coin price is below the supply levels, indicating a bearish trend.
The bears’ touch at the $0.0000155 low level in the past session has contributed to the altcoin’s recent bearishness. Nevertheless, the Lucky Block price is about to break out from the support level and maintains a bullish position as a new correction has just begun.
Today’s 4-hourly bullish candle at the $0.0000161 high level below the moving averages confirms the bulls’ return to the market and breakout from the support level. This breakup may accelerate the bullish momentum and extend the ongoing correction to a higher level.
Meanwhile, further upsides are certain as indicated by the price indicator pointing upwards, suggesting that the LBLOCKUSD price will break from support soon; and in this case, the bullish correction pattern might extend the coin price to the $0.0001200 upper resistance value in the days to come in the medium-term outlook.
You can purchase Lucky Block here. Buy LBLOCK


Leave a Reply