Lucky Block Price Prediction- November 15
LBLOCKUSD price is bound to move up and gain more strength if all the current support holds and the bulls should trigger their efforts and break up the $0.0002241 resistance trend line, the bullish correction pattern may extend the coin price to hit the $0.03000 high mark. Thus, a turnaround and clear buys signal for the coin holders.
Levels:
Resistance levels: $0.0002300, $0.0002400, $0.0002500
Support levels: $0.0001400, $0.0001300, $0.0001200
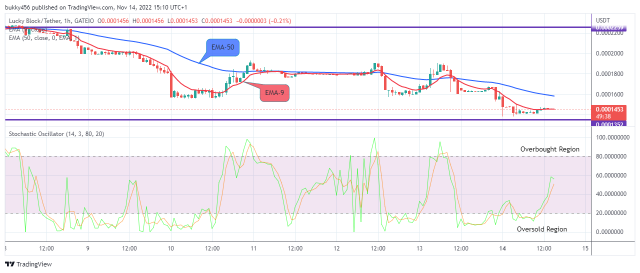
LBLOCKUSD Long-term Trend: Bearish (1H Chart)
As an outcome of low bullish momentum, the LBLOCKUSD pair is in a bearish momentum in its long-term outlook. Sellers are hindering the market from smashing through the resistance zone.
The bulls made an increase to the $0.0001445 high mark shortly after the opening of the 1-hourly session today. The short traders interrupted and dropped the coin price to a low of $0.0001443 value.
Meanwhile, there is a possibility of a bullish breakout soon as the market is oversold. If the bulls should add more efforts to the tension in the market. The next target could be the $0.03000 supply trend mark in the long-term perspective.
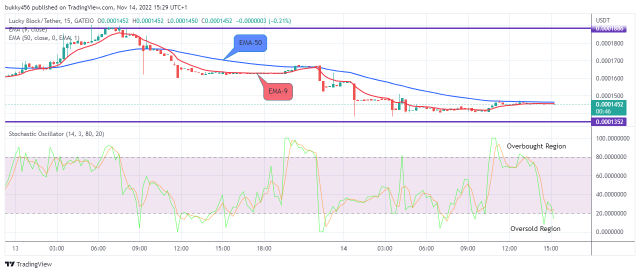
LBLOCKUSD Short-term Trend: Bearish (15-Minutes Chart)
The LBLOCKUSD pair is in the bearish trend zone on the lower time frame. The coin price bars are sighted below the moving averages, indicating a downtrend.
The coin price opened lower but managed to trade in green over the past few hours as the 15-minute session begins today. The price finds reliable resistance at the $0.0001452 supply mark below the two EMAs, resulting in intraday gains. This shows that buyers are still buying the coin and will push the coin price further.
Now that the market price of Lucky Block is oversold, we can therefore expect the buy traders to push the coin price above the overhead resistance trend line which may possibly reach the $0.03000 supply trend line in the coming days in its lower time frame.
You can purchase Lucky Block here. Buy LBLOCK
Learn to Trade Forex Online
Lucky Block Price Prediction: LBLOCKUSD Price Will Rise Further, the $0.03000 High Value Might be the Target
Footer

ForexSchoolOnline.com helps individual traders learn how to trade the Forex market
WARNING: The content on this site should not be considered investment advice and we are not authorised to provide investment advice. Nothing on this website is an endorsement or recommendation of a particular trading strategy or investment decision. The information on this website is general in nature so you must consider the information in light of your objectives, financial situation and needs.
Investing is speculative. When investing your capital is at risk. This site is not intended for use in jurisdictions in which the trading or investments described are prohibited and should only be used by such persons and in such ways as are legally permitted. Your investment may not qualify for investor protection in your country or state of residence, so please conduct your own due diligence or obtain advice where necessary. This website is free for you to use but we may receive a commission from the companies we feature on this site.
We Introduce people to the world of currency trading. and provide educational content to help them learn how to become profitable traders. we're also a community of traders that support each other on our daily trading journey
Forexschoolonline.com is not a financial advisor. Do your research before investing your funds in any financial asset or presented product or event. We are not responsible for your investing results.

Leave a Reply