Lucky Block Price Prediction- May 22
There is a possibility for the LBLOCKUSD price to overcome the support level and break up the resistance trend lines. The coin may likely experience a bullish reversal price action and the price could be ready very soon for another upward move potential. Should buyers interrupt the sell traders at the current support of $0.0000902 level by pushing higher, the bullish pattern may increase the coin price to rise further to retest its previous high of $0.0003038 value which might possibly hit the $0.02000 upper supply trend line and beyond.
Levels:
Resistance levels: $0.0002100, $0.0002200, $0.0002300
Support levels: $0.0001100, $0.0001000, $0.0000900
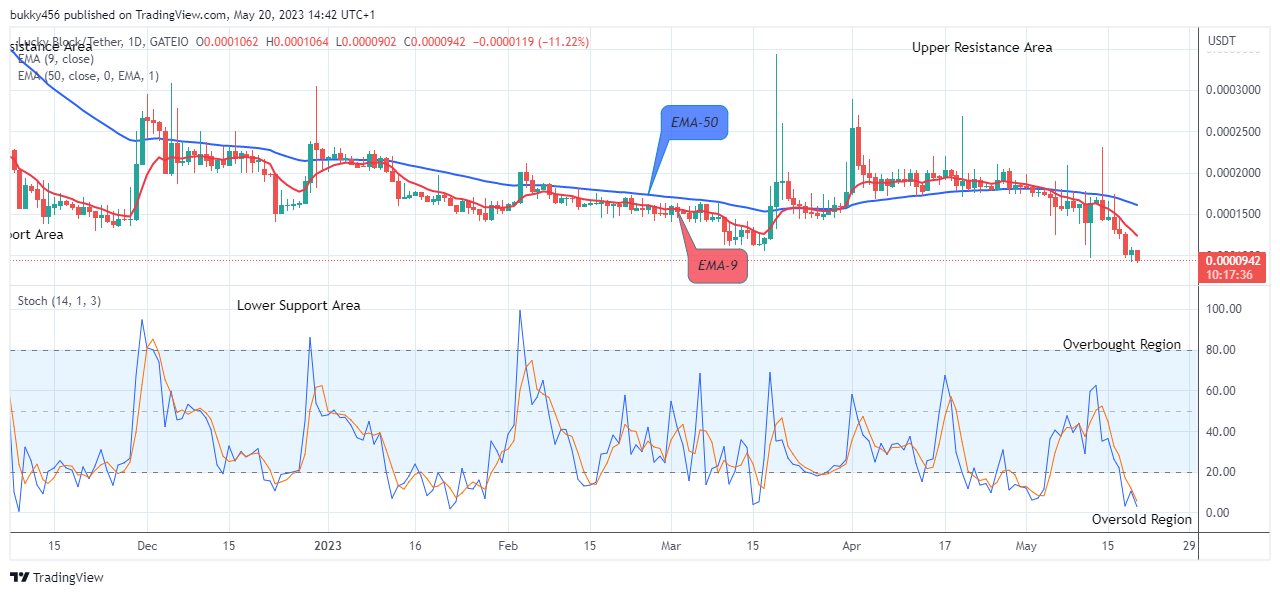
LBLOCKUSD Long-term Trend: Bearish (4H Chart)
Lucky Block is in a bearish trend market zone in its long-term outlook. The coin price can be seen trading below the supply trend levels. This is due to the high inflow from the sell traders. 
The sustained pressure from the bears to the $0.0000970 support level in the past few days has contributed to its bearishness in its recent low.
The price responded to the shift in the market structure and is currently trading below the moving averages at the $0.0000902 support level as the daily chart opens today. Meanwhile, the current price at a $0.0000902 low value below the supply trend lines has not stale the market condition of the crypto. Thus, traders who buy the coin during the bearish market will also make gains in the future.
Hence, should the bulls exchange hands with the sell traders and close above the $0.0003083 resistance value, additional intraday gains would be recorded for the buy investors.
In a like manner, LBLOCKUSD is likely going to reverse and face the upsides to overcome the bearish trend as the market is now trading below the 5% range of the daily stochastic; it means that the selling pressure will end soon. This will compel the buy traders to resume an uptrend and may likely break up the $0.0003083 supply level soon to hit the $0.02000 upper resistance level in its higher time frame.
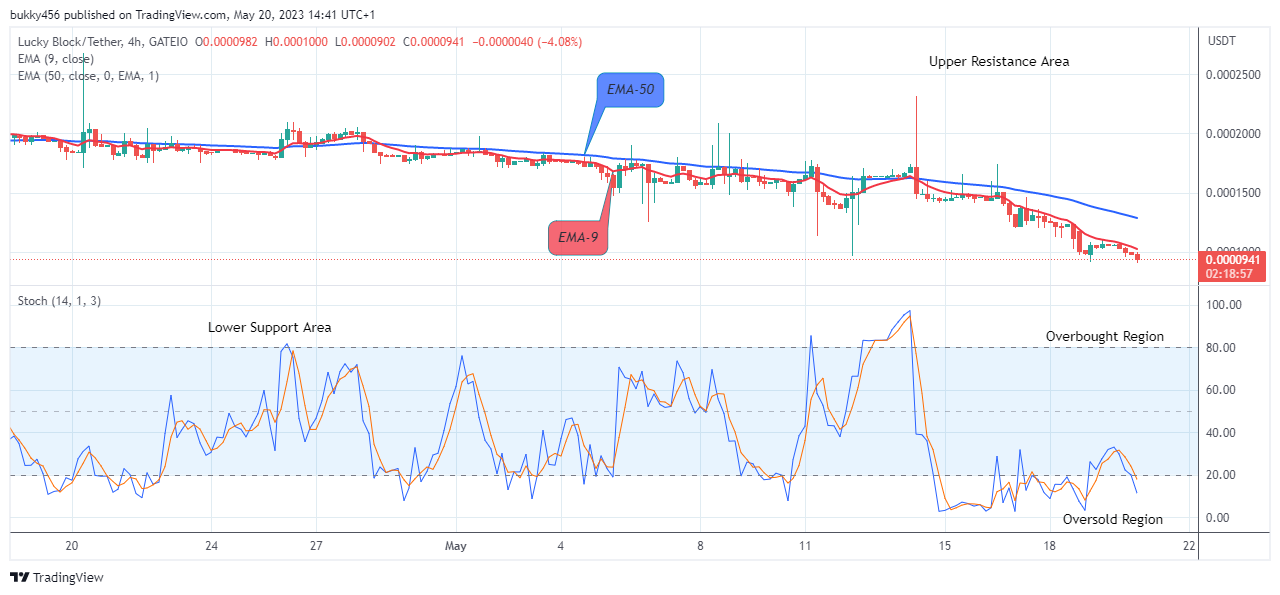
LBLOCKUSD Medium-term Trend: Bearish (1H Chart)
The LBLOCKUSD price is also in a bearish move in its medium-term outlook. The coin price can be seen below the two EMAs which are fanned apart. This is due to the high inflows from the sell traders which may soon fade off. 
The price drop to the $0.0001050 low value during the previous action has made the coin price trade below the supply levels in its recent low.
The bears dropped the coin price to a low at $0.0000902 value below the two EMAs as the 1-hourly chart resumes today. If the bulls could change their orientation and increase their buying motives, the price of Lucky Block may possibly turn up from the $0.0000902 support value and jump above the $0.0002681 supply mark, this would invalidate any further bearish thesis.
Meanwhile, traders who buy the coin during the bearish market will also make a profit. It is worth of note that traders who buy the coin during the bearish market will also make a profit.
In addition to that, there is a higher probability of the price breaking up its resistance level of $0.0002681 and going up much further if the bulls could add extra effort to their buying activities.
Next, the coin has fallen below the level of 10% of the daily stochastic. It indicates that the pair is now in the oversold region of the market. It implies that the selling pressure is likely to run to an end soon. We will now be looking into the emergence of buyers to turn the price of LBLOCKUSD upside, as a result of this, the coin price may reach $0.02000 in the coming days in its medium-term perspective.
You can purchase Lucky Block here. Buy LBLOCK


Leave a Reply