Lucky Block Price Prediction- March 31
The Lucky Block price is very likely to face the positive side to retest the $0.0003429 supply level soon after completing the dip lows. Therefore, if the bulls could push harder and break up from the current supply level of $0.0001499, the trapped bullish momentum will be released and the upcoming bullish pattern may push the coin price higher to the $0.02000 resistance mark.
Levels:
Resistance levels: $0.002500, $0.002600, $0.002700
Support levels: $0.001850, $0.001750, $0.001650
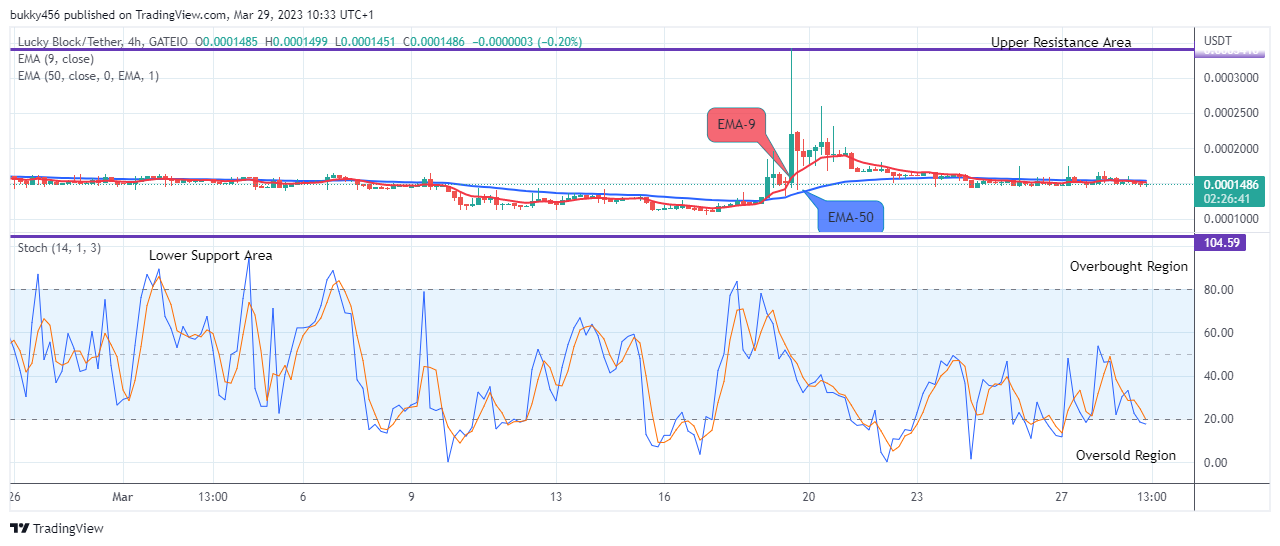
LBLOCKUSD Long-term Trend: Bearish (4H Chart)
LBLOCKUSD is currently trading below the moving averages in its long-term view, this means that the price is in a bearish trend.
The price drop to the $0.0001498 low value during the previous action has made the coin price trade below the supply levels. This will soon be invalidated as the trend has just resumed its rising pattern but has not yet reached its goal.
The price responded to the shift in the market structure and is currently below the moving averages at the $0.0001499 high level as the 4-hourly chart opens today. This indicates the gradual response from the bulls to the market activities at the present. Thus, the pressure to acquire the crypto would increase if it broke beyond the $0.0002599 high mark.
In addition to that, the market’s daily stochastic is pointing up, which will attract more buyers to the market in search of a bullish continuation pattern. If that happens, the price may further climb up to retest the $0.0003429 previous high soon which would strengthen the bullish trend in the long-term perspective.
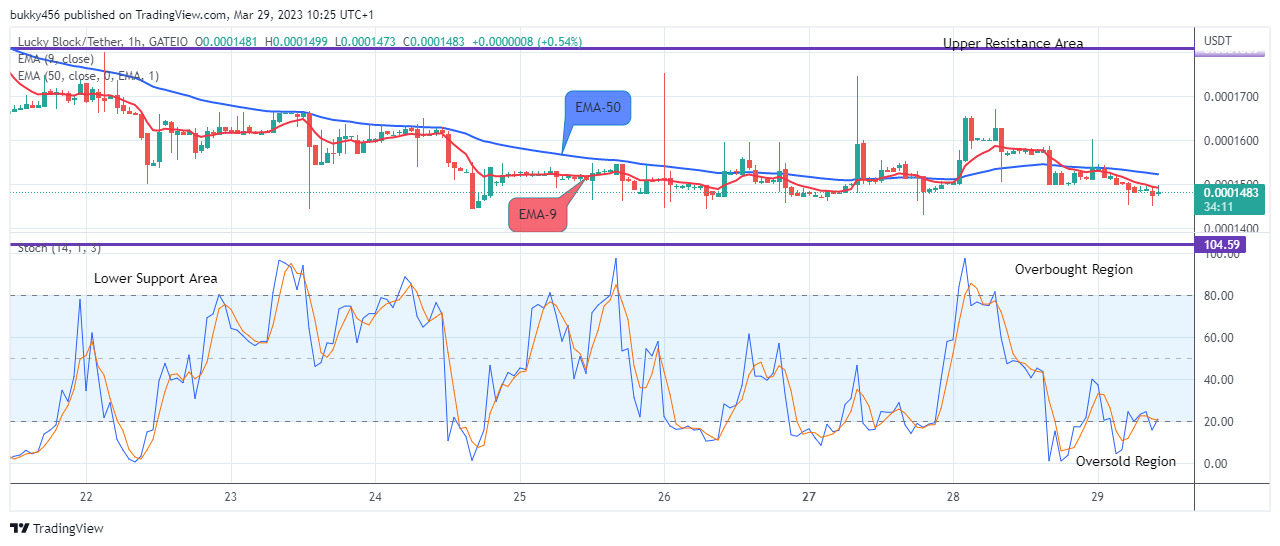
LBLOCKUSD Medium-term Trend: Bearish (1H Chart)
The cryptocurrency is in a bearish market zone in its medium-term outlook. The bears are now involved in the order flow.
The sustained bearish pressure on the crypto at the $0.0001510 low value during the previous action has dropped the coin price below the trend level.
After completing the low-dips at the $0.0001451 level, the bulls made a corrective move to the $0.0001499 resistance level below the moving average lines to resume the uptrend as the 1-hourly chart opens today. This bullish continuation pattern occurs in an uptrend and indicates a potential trend reversal.
Next, we can expect the emergence of more buy investors as the selling pressure is exhausted already, as indicated by the daily stochastic. Thus, the next bull race may reach the previous high of $0.0003429 level as we watch the bulls take over the market conditions sooner in its medium-term perspective.
You can purchase Lucky Block here. Buy LBLOCK
Learn to Trade Forex Online
Lucky Block Price Prediction: LBLOCKUSD Price Might Possibly Retest the $0.0003429 Supply Level Soon
Footer

ForexSchoolOnline.com helps individual traders learn how to trade the Forex market
WARNING: The content on this site should not be considered investment advice and we are not authorised to provide investment advice. Nothing on this website is an endorsement or recommendation of a particular trading strategy or investment decision. The information on this website is general in nature so you must consider the information in light of your objectives, financial situation and needs.
Investing is speculative. When investing your capital is at risk. This site is not intended for use in jurisdictions in which the trading or investments described are prohibited and should only be used by such persons and in such ways as are legally permitted. Your investment may not qualify for investor protection in your country or state of residence, so please conduct your own due diligence or obtain advice where necessary. This website is free for you to use but we may receive a commission from the companies we feature on this site.
We Introduce people to the world of currency trading. and provide educational content to help them learn how to become profitable traders. we're also a community of traders that support each other on our daily trading journey
Forexschoolonline.com is not a financial advisor. Do your research before investing your funds in any financial asset or presented product or event. We are not responsible for your investing results.

Leave a Reply