Lucky Block Price Prediction – November 19
The LBLOCKUSD price may increase further to break up the $0.0000389 resistance level, provided buyers add more aggression to their buying pressure and don’t give up. After testing the support level, a usual response would be a bullish reversal; therefore, if the coin price could sustain above the pattern supply trend line, the price may trigger up to the overhead resistance mark at the $0.000800 level, signaling an uptick in investors’ interest.
Levels:
Resistance levels: $0.0000203, $0.0000204, $0.0000205
Support levels: $0.0000180, $0.0000170, $0.0000160
LBLOCKUSD Long-term Trend: Bearish (Daily Chart)
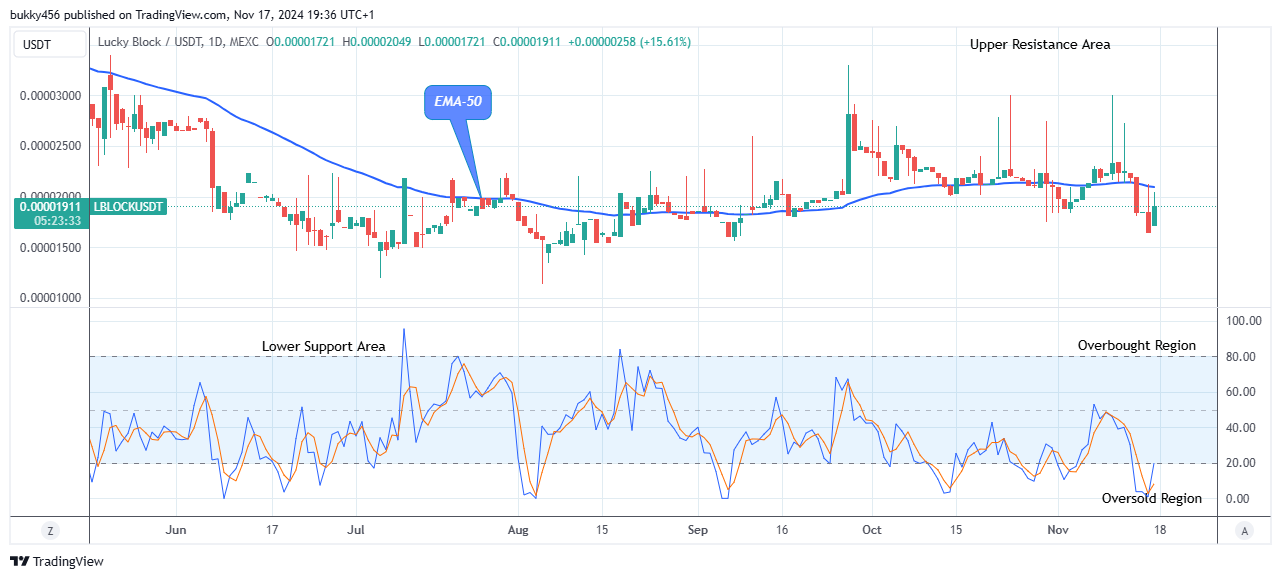
Lucky Block’s price is bearish on the higher time frame. The price is trending below the supply levels and may break up the resistance levels soon. The price bar can be seen in green below the moving averages, due to the high order flow of the sell traders. 
The previous action of the bears at a $0.0000164 low value has added to its bearishness in its recent price level. However, the bulls are set to swing the coin price to a higher level as a new correction has taken place below the trend levels.
The current price of the LBLOCKSD pair at the $0.0000204 high level below the EMA-50 as the daily session opens today indicates the investors’ optimism to increase the trend and this may break up the crucial resistance level.
The buy traders can grab this short bullish upswing to the overhead resistance, but the fate of Lucky Block’s near future price depends on the range breakout.
Hence, the current correction phase may likely continue as the momentum indicator points upwards; we can now expect the LBLOCKUSD price to break up the $0.0000398 previous barrier to reach a significant level of $0.0000800 supply trend line as the bulls continue with their bullish correction to break up the crucial resistance level and remain dominant soon in its long-term perspective.
LBLOCKUSD Medium-term Trend: Bearish (4H Chart)
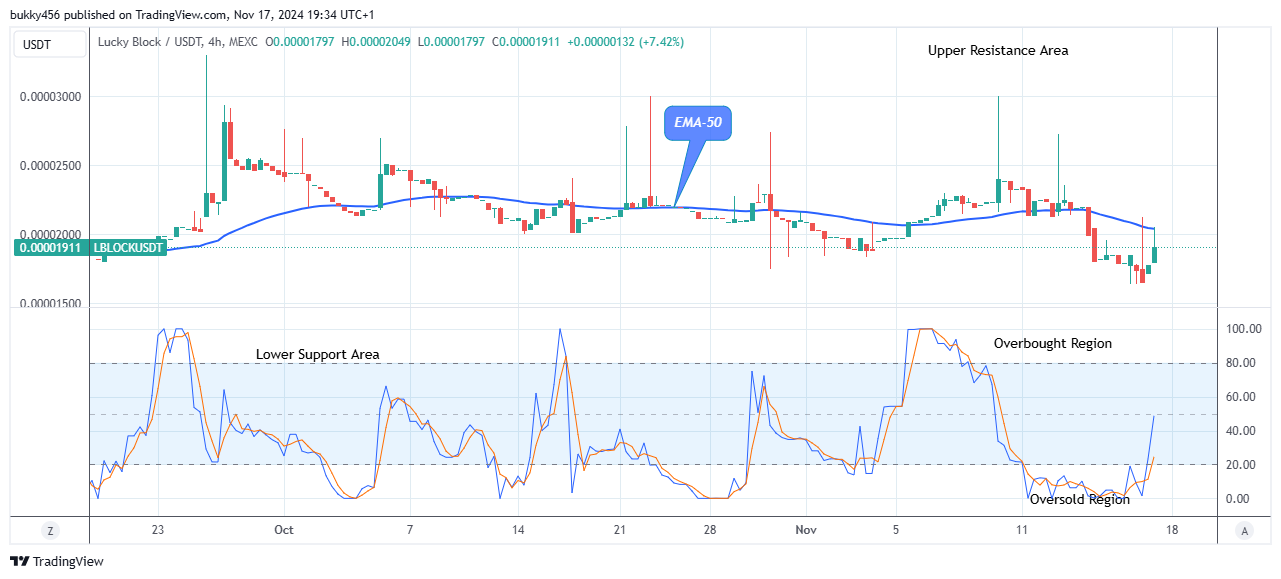
LBLOCKUSD price retracement may break up the crucial resistance level as the new corrective moves begin with a bearish sentiment in its medium-term perspective. The coin is trading below the EMA-50, indicating a bearish trend. However, the market is presently facing resistance at the recent high due to the returns of the bulls into the market.
At the writing time, the Lucky Block price which increased from the $0.0000179 level to the $0.0000204 resistance level below the moving averages as a retracement move, affirms the presence and the impact of the bulls in the market, eyeing the price to break up at $0.0000330 resistance level, bolstering the bullish momentum.
Thus, closing the 4-hourly session above $0.0000330 will put the trade more on the buying side, proving a profitable opportunity for coin traders.
In conclusion, the LBOCKUSD pair pointing up on the daily stochastic implies that the buying pressure may continue, and suggests a possible recovery of the $0.0000800 supply level which may further break up at $0.00012000 upper resistance level in the coming days in the medium-term time frame.
You can purchase Lucky Block here. Buy LBLOCK


Leave a Reply