Lucky Block Price Prediction – December 30
The Lucky Block price could see another upbeat trend soon as the selling pressure is about to end. This would prepare the market for the emergence of buy traders who will move it across the crucial level. The cryptocurrency is about completing the dip-low movement and is on the verge of a correction phase. The coin price might rebound and turn upside as the market is oversold. Hence, if all the current support holds and the bulls push higher, the price breakout may test the previous high at a $0.0000330 high value, likely hitting the $0.0000800 upper supply trend line.
Key Levels:
Resistance levels: $0.0000230, $0.0000235, $0.0000240
Support levels: $0.0000141, $0.0000140, $0.0000139
LBLOCKUSD Long-term Trend: Bearish (Daily Chart)
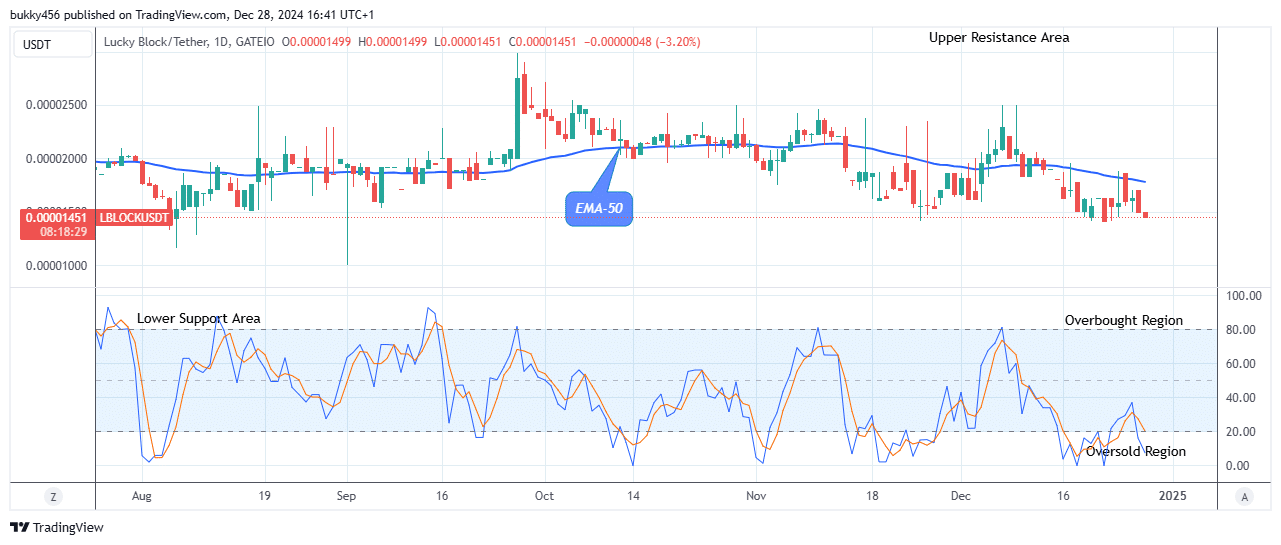
LBLOCKUSD is having a bearish posture and could see another upbeat trend as the selling pressure seems to be ending soon on the daily chart. The price is below the EMA-50, indicating a downward momentum and the high impact of sellers in the market.
The sell traders made a downward move to the $0.0000149 support level before the end of yesterday’s session. This gave sellers more strength to continue with the trend in its recent low. Hence, the crypto market is now oversold and could see another upbeat trend.
Today, actions from the sell traders further tumbled the LBLOCKUSD price to a low of $0.0000145 below the supply levels, as a result of low bullish momentum. Meanwhile, buyers may seize this opportunity to buy the coin at a lower rate for a better gain in the future.
Further, if the bulls could trigger their forces in the market, the coin price could see another upbeat trend to retest the previous high of $0.0000330 level, resulting in a high recovery potential for the coin buyers.
In conclusion, the Lucky Block pair is likely going to reverse and could see another upbeat trend as the market is now trading in the oversold region around the 3% range of the daily stochastic, suggesting that the selling pressure will end soon.
This will compel the buy traders to resume an upbeat trend and may likely break up the $0.0000330 supply level to hit the $0.0000800 upper resistance in the days ahead in its higher time frame.
LBLOCKUSD Medium-term Trend: Bearish (4H Chart)
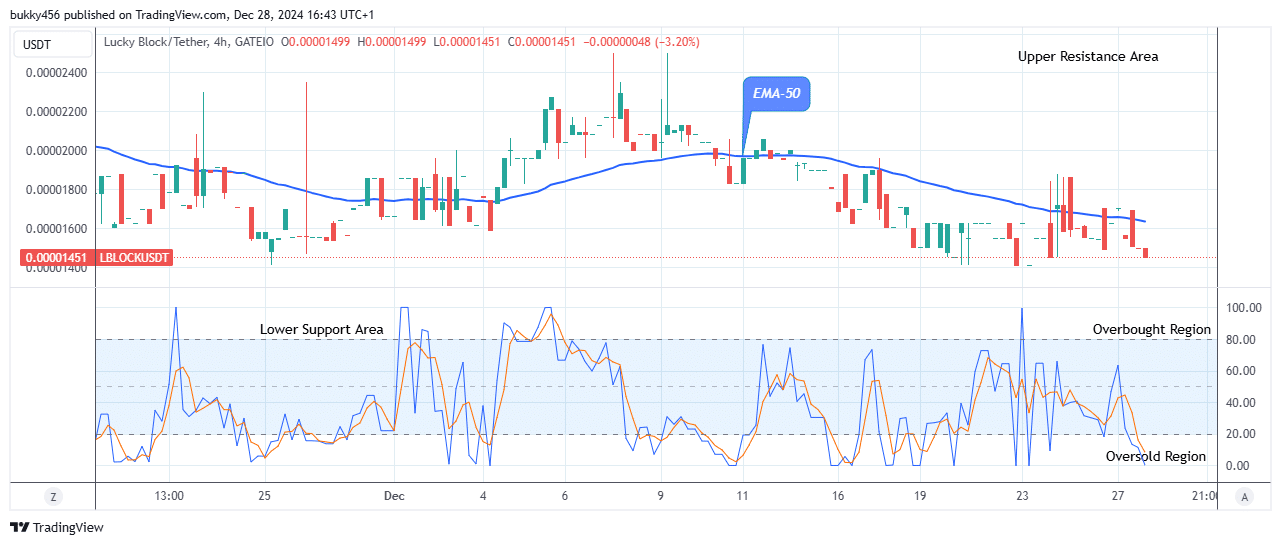
On the medium-term chart, LBLOCKUSD is in a downward movement and could see another upbeat trend as it reaches the oversold region. This is clear as the price continues to make lower highs and lower lows.
The Lucky Block price hovers at 0.0000145 support level below the moving averages as the 4-hourly chart begins today. All eyes are glued on $0.0000250 but seller congestions at the mentioned support have become impenetrable.
Thus, if the coin buyers could change their orientation and exchange hands with the sell traders at the $0.0000145 current support, the LBLOCKUSD price could see another upbeat trend to hit the $0.0000250 peak value, leading to an intraday gain for coin traders.
Furthermore, the LBLOCKUSD pair might finish the downward correction and start reversing as the market is already oversold. If this is achieved by the long-term investors, the pair could see another upbeat trend, and the recovery rally may reach the $0.0000800 upper high value in the coming days in its medium-term perspective.
You can purchase Lucky Block here. Buy LBLOCK


Leave a Reply