Lucky Block Price Prediction- September 13
There is a possibility for the Lucky Block price to further its rally up and test the $0.000850 resistance level. Should the bulls increase their pressure, the supply level of $0.000824 may not hold and it may be exposed to another supply level at the $0.001000 supply level.
Levels:
Resistance levels: $0.001250, $0.001350, $0.001450
Support levels: $0.000670, $0.000570, $0.000470 LBLOCKUSD Long-term Trend: Bullish (4H Chart)
From the chart above we can be assured that LBLOCKUSD is in a bullish move in its long-term view. The sustained bullish pressure pushed the pair up to the $0.000814 resistance level during yesterday’s session and sustained it.
The aggressive move by the buyers further pushes the price of Lucky Block up to a $0.000824 high level above the moving averages as the 4-hourly chart opens today; an indication of more bulls present in the market.
The coin is pointing up around the level 50% range of the daily stochastic; indicating more possibly upside ahead in its higher time frame.
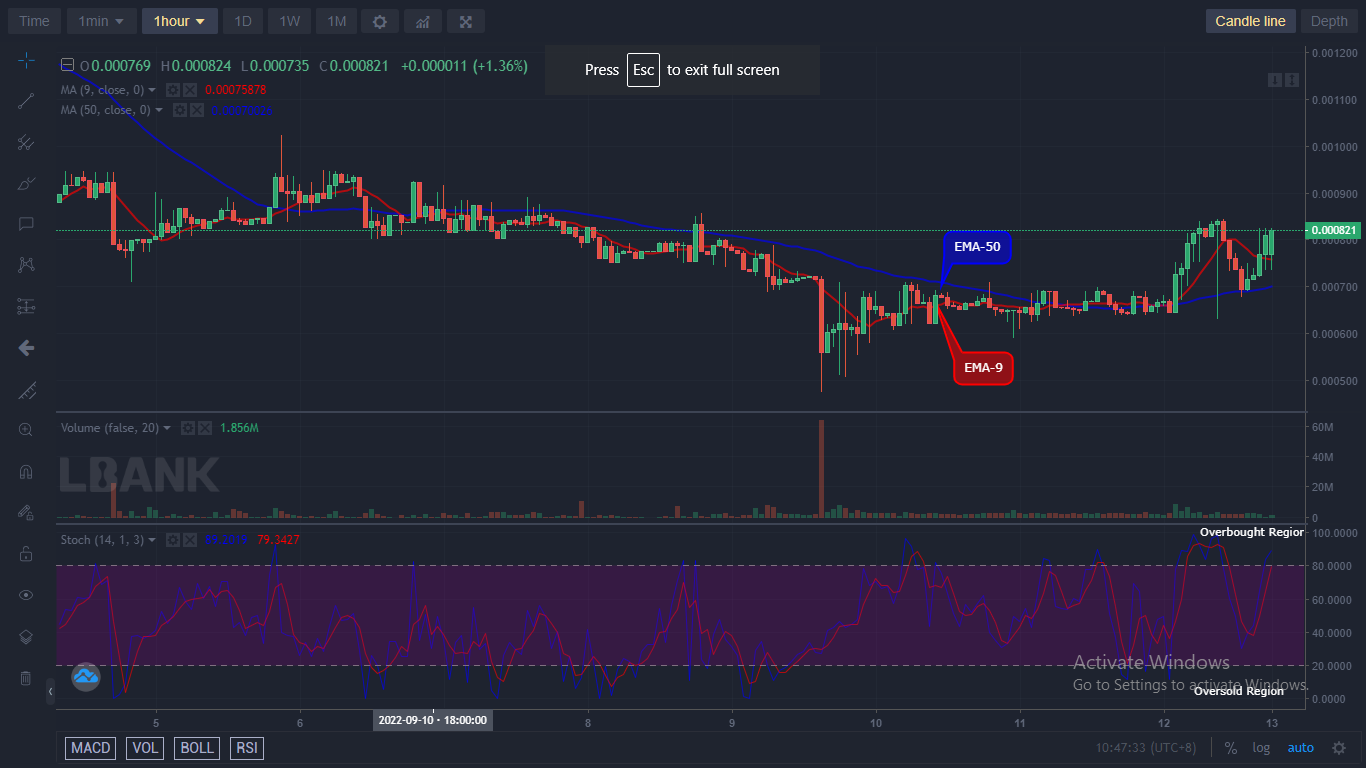
LBLOCK/USD Medium-term Trend: Bullish (1H Chart) The currency pair is in an upward move in its medium-term outlook. The currency pair’s orientation trades in a general bullish flow.
The buy traders made it up to a $0.000844 high level after which the bears interfered and dropped the price down to the $0.000678 support level as the 1-hourly chart opens today.
The bears lost momentum, and the price action of LBLOCKUSD at a $0.000822 high level above the moving averages at the moment indicates more bullish forces in the market.
The market value of Lucky Block which trades above the moving averages may likely give the coin the tendency to rise further.
Therefore, if the bulls increase their tension in the market, the price tendency will move above the key levels.
You can purchase Lucky Block here. Buy LBLOCK
Learn to Trade Forex Online
Lucky Block Price Prediction: LBLOCKUSD Potential for Bullish Rise
Footer

ForexSchoolOnline.com helps individual traders learn how to trade the Forex market
WARNING: The content on this site should not be considered investment advice and we are not authorised to provide investment advice. Nothing on this website is an endorsement or recommendation of a particular trading strategy or investment decision. The information on this website is general in nature so you must consider the information in light of your objectives, financial situation and needs.
Investing is speculative. When investing your capital is at risk. This site is not intended for use in jurisdictions in which the trading or investments described are prohibited and should only be used by such persons and in such ways as are legally permitted. Your investment may not qualify for investor protection in your country or state of residence, so please conduct your own due diligence or obtain advice where necessary. This website is free for you to use but we may receive a commission from the companies we feature on this site.
We Introduce people to the world of currency trading. and provide educational content to help them learn how to become profitable traders. we're also a community of traders that support each other on our daily trading journey
Forexschoolonline.com is not a financial advisor. Do your research before investing your funds in any financial asset or presented product or event. We are not responsible for your investing results.

Leave a Reply