Lucky Block Price Prediction- September 3
Lucky Block faces strong rejection near the critical $0.001260 level as it forms a support zone. A good close above the $0.002520 resistance value would bring in more gains.
Levels:
Resistance levels: $0.002000, $0.002100, $0.002200
Support levels: $0.001370, $0.001270, $0.001170 LBLOCKUSD Long-term Trend: Bearish (4H Chart)
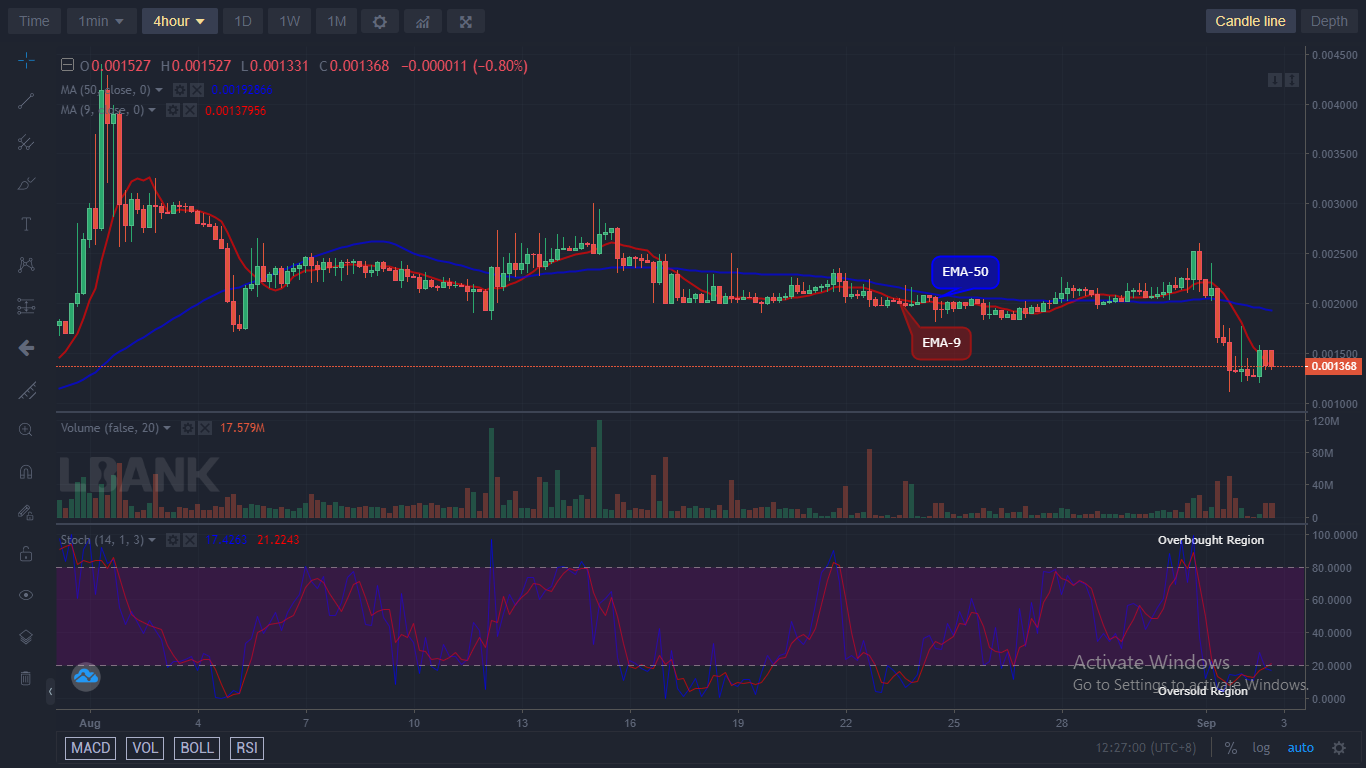
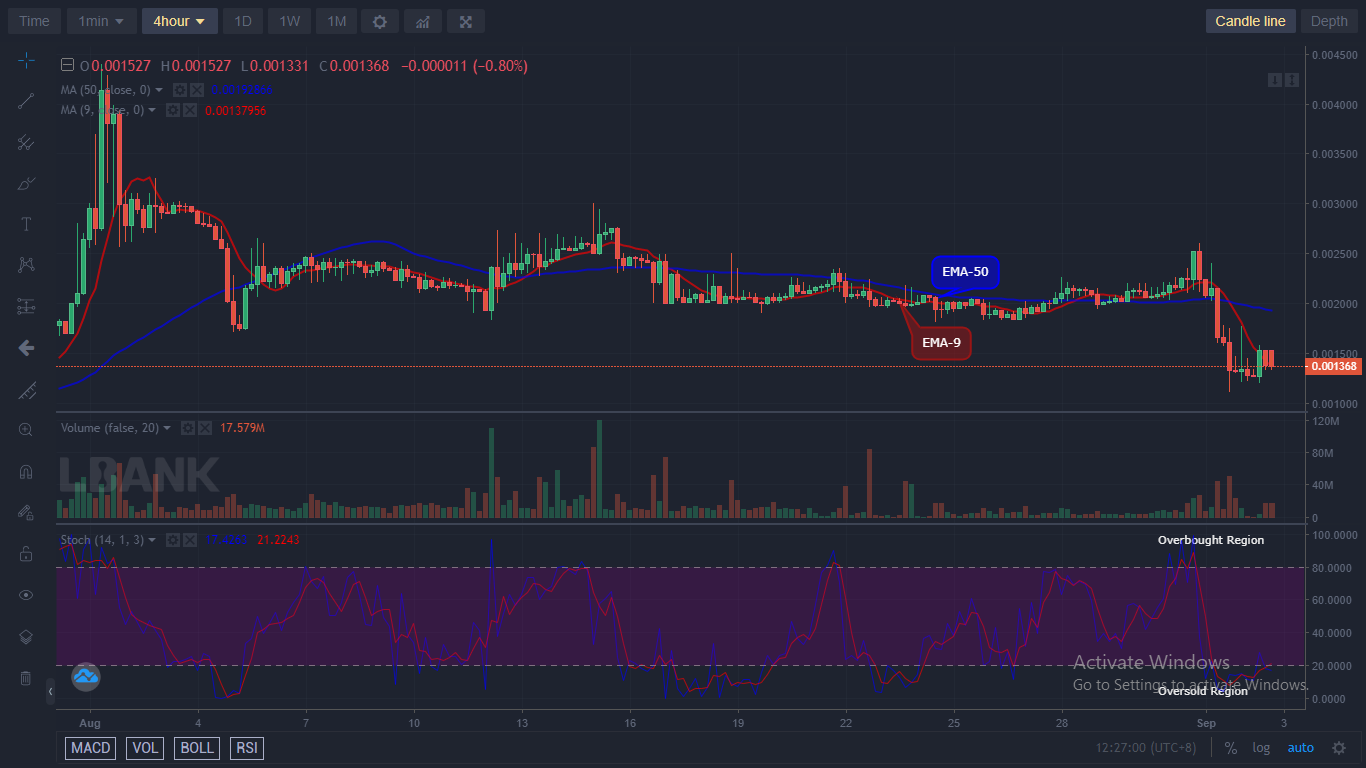
The coin is in a bearish market zone in its long-term perspective. The price of Lucky Block is seen slightly below the two EMAs and has confirmed a bearish momentum breaking the previous low.
The cryptocurrency at the time of writing has been able to ride up to a $0.001579 supply level as the 4-hourly chart opens today. However, trading below a $0.001331 low level could be a warning sign for the bulls. Therefore, if the bulls should redouble their efforts in the market, more upsides will be achieved.
Additionally, with the daily stochastic alerts of more jumps ahead with an oversold market structure, we expect the price of LBLOCKUSD to move upside in a short while to a $0.2500 supply level and beyond in its long-term outlook.
LBLOCKUSD Medium-term Trend: Bearish (1H Chart) LBLOCKUSD is trading in a bearish market at the moment in its lower time frame. From the chart below, the price can be seen below the EMAs.
The market price at the $0.001375 supply level is approaching the retest of $0.002300 above the moving averages; this implies that the bulls are now preparing to take their stand in the market.
Thus, an upside recovery can be predicted as the coin currently trades in the oversold region of the market. The next move towards $0.002500 and beyond is expected of the bulls as the market turns bullish soon in its short-term perspective.
You can purchase Lucky Block here. Buy LBLOCK
Learn to Trade Forex Online
Lucky Block Price Prediction: LBLOCKUSD May Jump above $0.002500 Supply Level Soon
Footer

ForexSchoolOnline.com helps individual traders learn how to trade the Forex market
WARNING: The content on this site should not be considered investment advice and we are not authorised to provide investment advice. Nothing on this website is an endorsement or recommendation of a particular trading strategy or investment decision. The information on this website is general in nature so you must consider the information in light of your objectives, financial situation and needs.
Investing is speculative. When investing your capital is at risk. This site is not intended for use in jurisdictions in which the trading or investments described are prohibited and should only be used by such persons and in such ways as are legally permitted. Your investment may not qualify for investor protection in your country or state of residence, so please conduct your own due diligence or obtain advice where necessary. This website is free for you to use but we may receive a commission from the companies we feature on this site.
We Introduce people to the world of currency trading. and provide educational content to help them learn how to become profitable traders. we're also a community of traders that support each other on our daily trading journey
Forexschoolonline.com is not a financial advisor. Do your research before investing your funds in any financial asset or presented product or event. We are not responsible for your investing results.

Leave a Reply