Lucky Block Price Prediction- November 12
LBLOCKUSD has been in a downtrend for a while and is on the verge of reversal at the moment. An increase in the bulls’ pressure may break up the supply mark at $0.002241 and this may swing up the crypto price to a $0.02000 high mark and beyond.
Levels:
Resistance levels: $0.0002300, $0.0002400, $0.0002500
Support levels: $0.0001800, $0.0001700, $0.0001600
LBLOCKUSD Long-term Trend: Bearish (1H Chart)
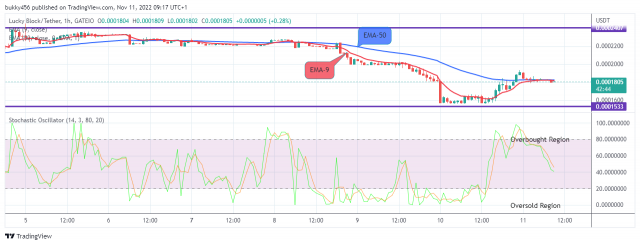
LBLOCKUSD is trading in the bearish trend zone in the long-term perspective. The coin reached the $0.0001805 high level as the 1-hourly chart opens today.
The market value of the pair at the $0.0001805 resistance value can be seen below the moving averages. The bulls are trying hard not to fall to the downside.
In addition, the momentum indicator shows that the price now is very close to the oversold region, meaning that a breakout by the bulls is imminent soon and in no long time the bullish correction rally might push the coin price to the $0.02000 resistance level in the days ahead in its higher time frame.
LBLOCKUSD Short-term Trend: Bearish (15-Minutes Chart)
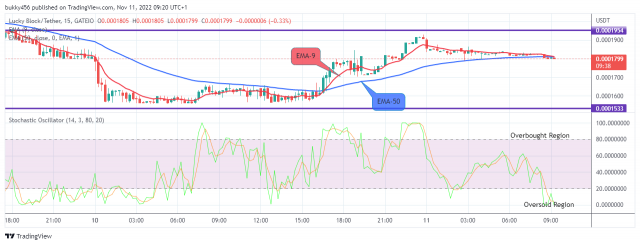
LBLOCKUSD pair is in a bearish market in its short-term outlook. The pair is currently trading below the $0.0001900 support value.
The smooth ride to the $0.0001832 high mark shortly after the 15-minutes session begins today indicates the high impact of the bulls in the market. The involvement of the bears however dumped Lucky Block’s price to the $0.0001799 low level below the moving averages. It is worth of note that buyers who invest in the coin at this trend will also make profits.
Further, the market is oversold already, this now calls for more buyers to emerge soon and push the crypto’s price further up, and in this case, the price might possibly hit the $0.02000 resistance value in the coming days in its lower time frame.
You can purchase Lucky Block here. Buy LBLOCK
Learn to Trade Forex Online
Lucky Block Price Prediction: LBLOCKUSD May Breakup the $0.0002241 Resistance Level Soon
Footer

ForexSchoolOnline.com helps individual traders learn how to trade the Forex market
WARNING: The content on this site should not be considered investment advice and we are not authorised to provide investment advice. Nothing on this website is an endorsement or recommendation of a particular trading strategy or investment decision. The information on this website is general in nature so you must consider the information in light of your objectives, financial situation and needs.
Investing is speculative. When investing your capital is at risk. This site is not intended for use in jurisdictions in which the trading or investments described are prohibited and should only be used by such persons and in such ways as are legally permitted. Your investment may not qualify for investor protection in your country or state of residence, so please conduct your own due diligence or obtain advice where necessary. This website is free for you to use but we may receive a commission from the companies we feature on this site.
We Introduce people to the world of currency trading. and provide educational content to help them learn how to become profitable traders. we're also a community of traders that support each other on our daily trading journey
Forexschoolonline.com is not a financial advisor. Do your research before investing your funds in any financial asset or presented product or event. We are not responsible for your investing results.

Leave a Reply