Lucky Block Price Prediction: June 14
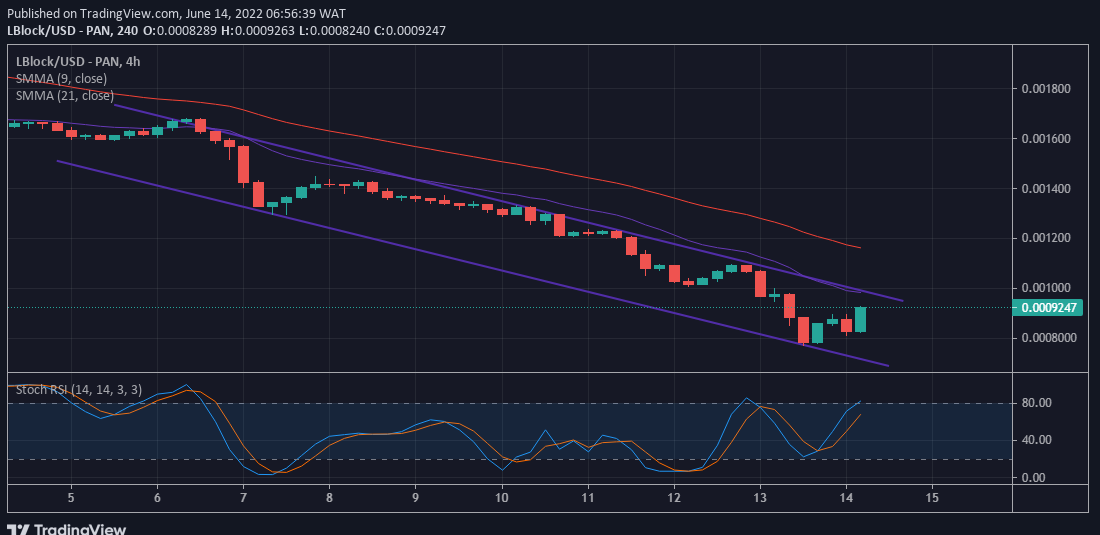
LBlock/USD price action shows a big positive sign at the appearance of a big bullish candle. The appearance of this candle signals the possibility of a Lucky Block price action, reaching higher price levels.
LBLOCK price now: $0.0009247
LBLOCK market cap: $40,2827,127
LBLOCK circulating supply: 40.77 Billion
LBLOCK total supply: 99,600,521,808
LBLOCK Coinmarketcap ranking: #3157
Key Levels:
Resistance levels: $0.0009247, $0.001000, $0.001100
Support levels: $0.0009000, $0.000800, $0.0007900

LBlock/USD Price Prediction: Lucky Block Price Action Shows Optimism
The Lucky Block 4-hours chart is becoming luckier with the appearance of a bullish trend reversal. The size of the bullish candle reflects how strong the new uptrend is likely to be. Also, on the 4-hours chart, the price action moves closer to the faster-moving average line.
Furthermore, if the faster-moving average should eventually cross below the price action, this may supply more strength to the uptrend. In addition, if the two moving averages should cross each other below the price action, this may see the LBlock/USD price reaching $0.001200 and $0.001300. Also, looking at the RSI indicator, we can that lines of the indicator are still rising as it approaches the oversold region. This is a sign which confirms that the price action is likely to rally higher.

LBlock/USD Price Prediction: Lucky Block Price Action is Pushing Higher
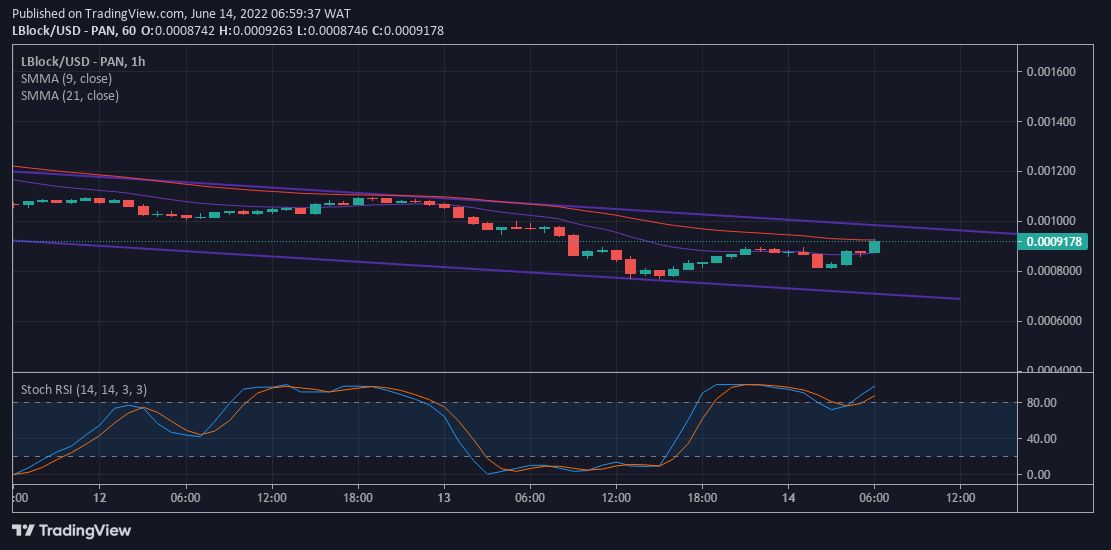
On the 1-hour chart the LBlock/USD Price action just gets luckier, as the fast MA passed below another bullish candle. At this point, it is more likely that the fast and slow MAs will cross below the price action. Consequently, this will supply more strength to the uptrend.
Finally, The RSI indicator lines are still rising, and the distance between them is considerably wide. Consequently, this implies that the Lucky Block price action will move higher to and perhaps beyond the $0.001000.
You can purchase Lucky Block here. Buy LBlock


Leave a Reply