Lucky Block Price Forecast: July 1
At this point, it appears as if buyers have been able to catch up with the sellers. Therefore, this implies that buyers can now push LBlock/USD price up from here.
LBlock present price: $0.0009259
LBlock market capitalization: $38.5 Million
LBlock circulating supply: 40.77 Billion
LBlock total supply: 99.6 Billion
LBlock Coinmarketcap ranking: #3820
Major Levels:
Resistance levels: $0.0009310, $0.0009360, $0.0009540
Support levels: $0.0009259, $0.0009220, $0.0009190

Lucky Block Price Forecast: LBlock/USD Buyers Get a Grip on Price Movement
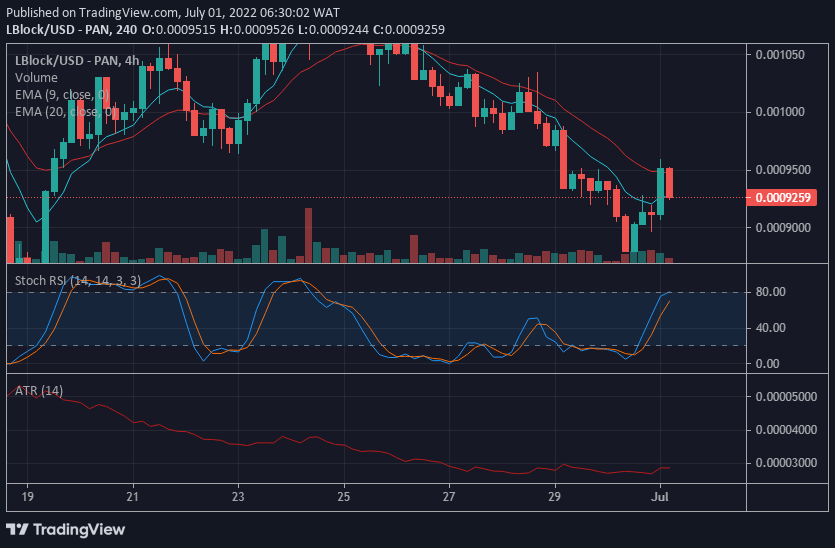
On the LBlock/USD 4-hour chart, it can be inferred from here that buyers now have control over the price movement. On this chart, the 9-day Exponential Moving Average curve is in contact with the last two candlesticks on the chart. Also, this indicator curves has been able to engulf the last red candlestick. The activity of this indicator shows the grip of buyers on price movement.
Aditionally, the Stochastic RSI is heading upwards – getting to the 80% mark. If the 80% mark could be reached, then Lucky Block’s price may each towards the $0.0009500. Additionally, the Average True Range has reversed direction, pointing upward and sideways. Consequently, this further portrays the activities of these crypto buyers.

Lucky Block Price Forecast: LBlock/USD Effort to Push Price
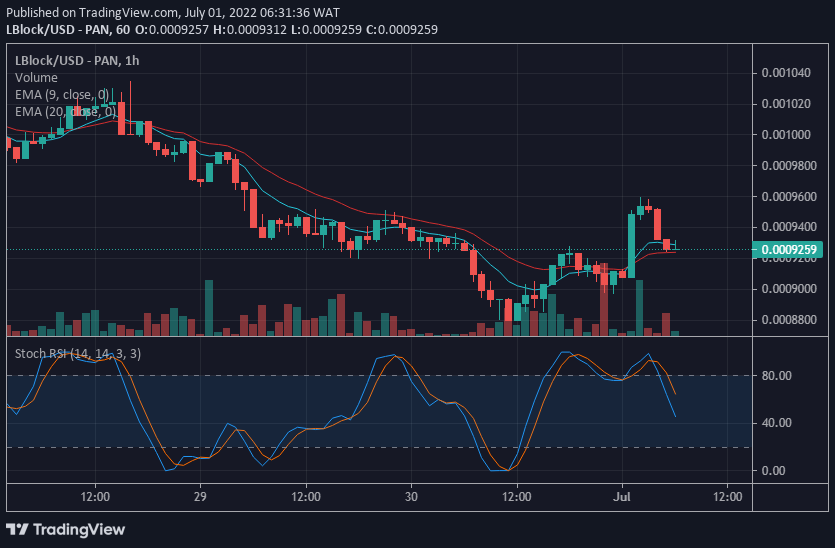
The LBlock/USD hourly chart further portrays that buyers are attempting to pump Lucky Block’s price up. The last candle appears to be an inverted bullish Doji. This further reveals that buyers are making efforts to push up the crypto’s price. Also, this implies that a bullish trend may be near.
In addition, the most recent candlesticks are arranged in what could be thought of as a corrective pattern. At this point, traders are advised to start buying as the crypto price is preparing to rise. Buying early will ensure proper profit.
You can purchase Lucky Block here. Buy LBlock


Leave a Reply