Lucky Block: 15th of August
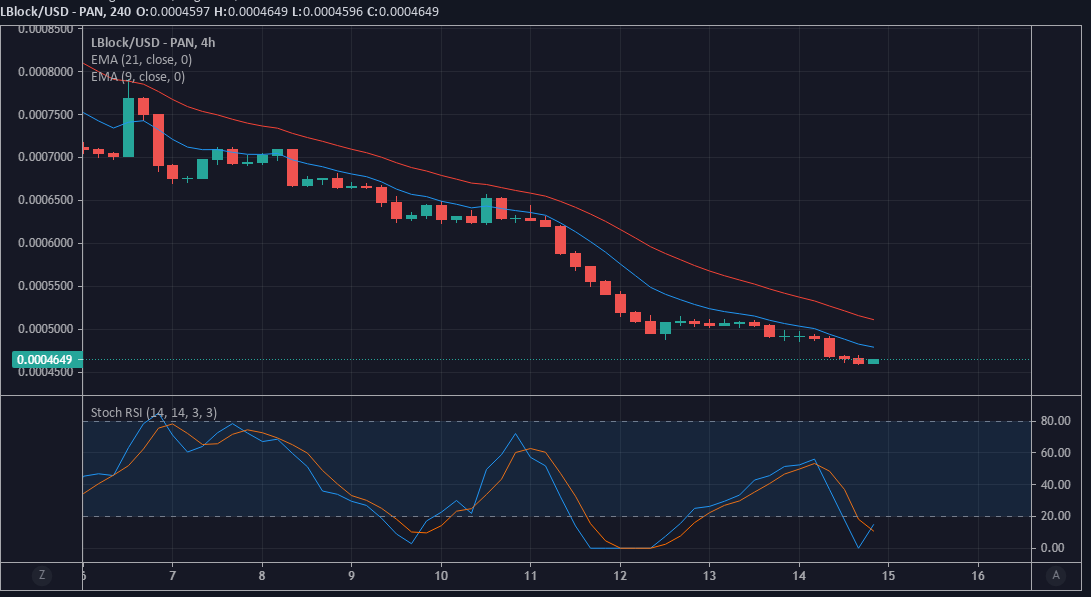
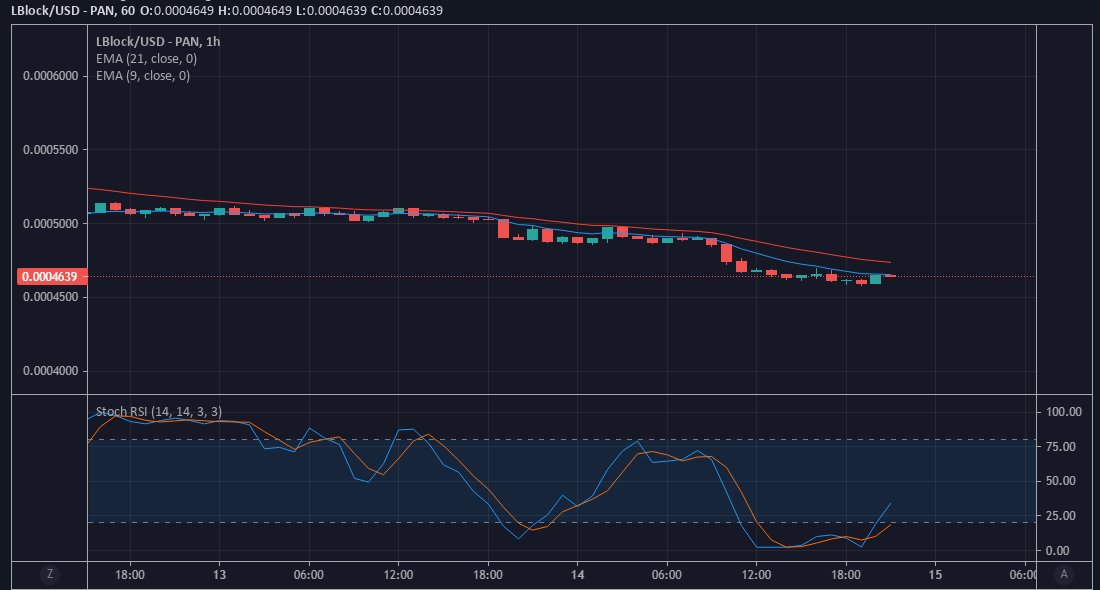
LBLOCK/USD Seems to have found a strong support near $0.0004600. Also, signs of subsequent upside gain are showing up in this market. If eventually, all these signs should fall in place, LBLOCK may soon find higher resistance shortly.
Current Value of LBLOCK now: $0.0004649
Lucky Block’s Market Capitalization: $51.6 million
Circulating Supply of Lucky Block: 40.77 billion
Lucky Block’s Total Supply: 99.6 billion
Lucky Block’s Coinmarketcap Position: #3021
Major Levels:
Top Levels: $0.0004635, $0.0004644, $0.0004649
Bottom Levels: $0.0004645, $0.0004640, $0.0004633

Lucky Block Price Analysis: Optimism Showing Up in LBLOCK/USD Chart
The LBLOCK/USD four-hour chart is displaying some optimism. The formation of a Bullish and much bigger dash candlestick is reflecting the attempt of buyers to push the price up. Additionally, the quicker Exponential Moving Average (EMA) has come closer to the price candles, as if to be trying to cross under the price movement. Also, the Stochastic Relative Strength Indicator (RSI) has just crossed on its way to the oversold. The display on the SRSI signifies that the price might soon be on its way upwards. Eventually, Lucky Block may soon find new resistance around $0.0004700, $0.0004800, and above.

Lucky Block Price Analysis: LBLOCK Optimism Brightens
On the LBLOCK/USD hourly chart hopes of subsequent price, gains brighten up. From this chart, we can see the 9/21-days Exponential Moving Average lines are now touching the price candles. As more buyers flood into the market, these lines will cross under the price candle. Eventually, this will propel Lucky Block Price upwards. The SRSI curves are also moving upwards in the direction of the overbought region. If the trend continues to gain momentum. Lucky Block will achieve the aforementioned levels. Therefore this could be an opportunity for Traders to profit from this market if they buy now.
You can purchase Lucky Block here. Buy LBlock


Leave a Reply