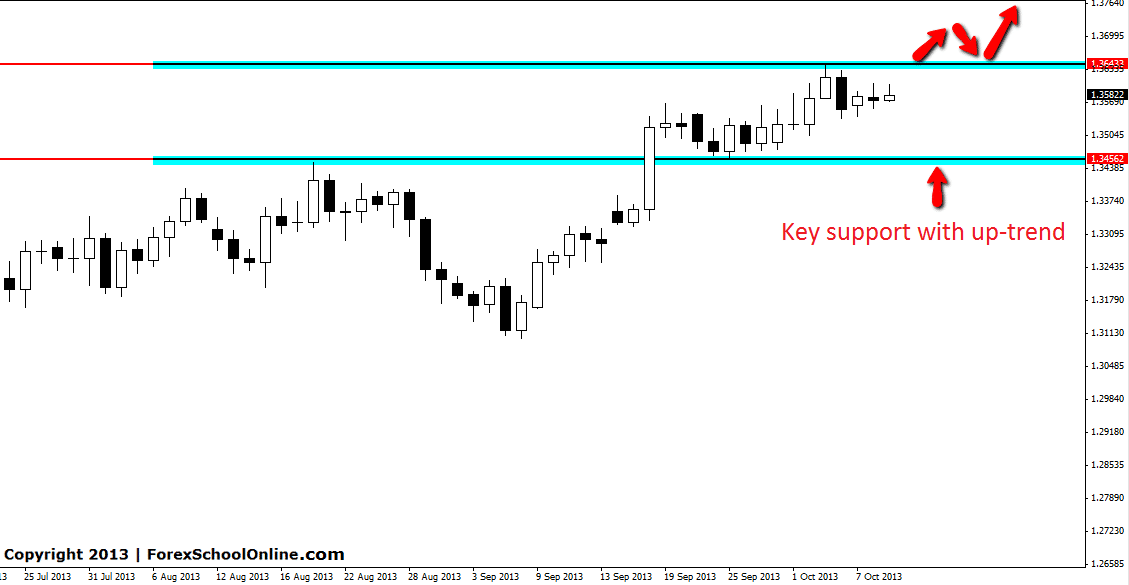
The EURUSD has moved into a major resistance area on the daily chart. Price has been in an up-trend on the daily chart in recent times with price making higher highs and higher lows with price now moving into this resistance. This resistance is a long term resistance that can be seen best on the weekly chart. If price can break through and higher past this resistance, then traders can look for this resistance to act as a price flip area and to start acting as a new support area.
Because price is currently in an up-trend, the best play is to look to trades with the trend. This will stay the case until price tells us that the trend has finished and then we will change our stance, but until then the best play is to continue trading with the obvious trend over and over again.
The best way to trade with the trend is to look for retracements or pull-backs back into value areas. If price rejects this resistance and moves back lower this could provide a solid pull-back into a value area that also lines up with a quality support area. This could be a high probability area for traders to target long trades on both their daily and intraday time frames. If price breaks the resistance and moves higher this could also provide a chance to trade with the trend. Traders could look for price to break through the resistance and then look for that old resistance to act as a new support to get long. See chart below:
EURUSD Daily Chart


😀
bakwas naa kar ..saala chawal 😛