Wowee there is a lot of 2 day chart price action at the moment… and 8 hour price action for that matter.
In this ‘Charts in Focus’ post I am going to take a look at the AUDSGD and EURAUD 2 day charts because in the video I posted most recently at Trick to Trading Multiple A+ Trades in Same Forex Pairs & Never Risking TOO MUCH… I looked at their charts and their price action story.
The reason I am drawn back to these markets when I rarely re-visit the same pair or make recap posts is because; I normally like to keep moving and to keep rolling with the fresh markets as they are continually evolving and keep you always up to date, but as I said at the start; just at the moment there are a lot of 2 day movements from the CADCHF to the EURUSD and the pairs we are about to look at below;
In the video I published for you last week I discussed the AUDSGD 2 day pin bar and daily BEEB on the EURAUD.
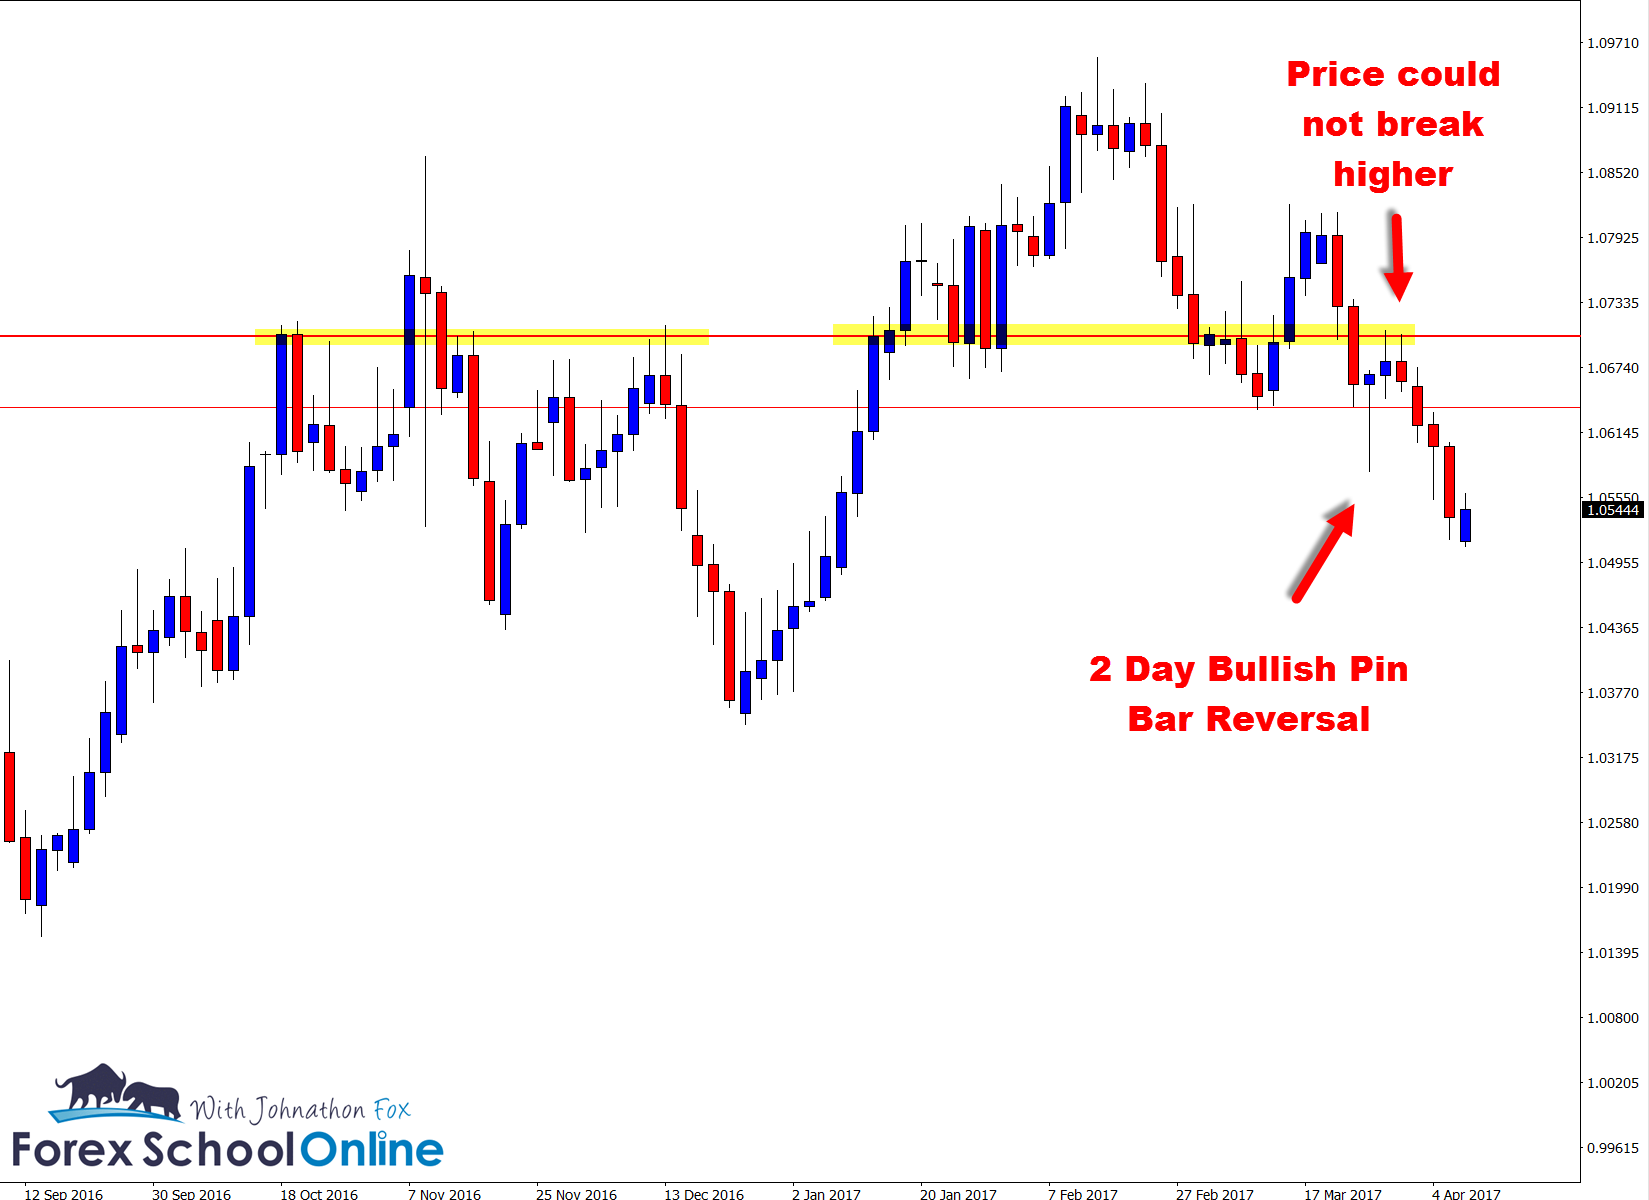
As we discussed with the AUDSGD pin bar we were needing to see if price could break the resistance it was sitting at and if it could it would then look to run higher into the next level. As you can see on the 2 day chart; price tipped the resistance overhead and then sold off back lower.
2 Day AUDSGD Chart

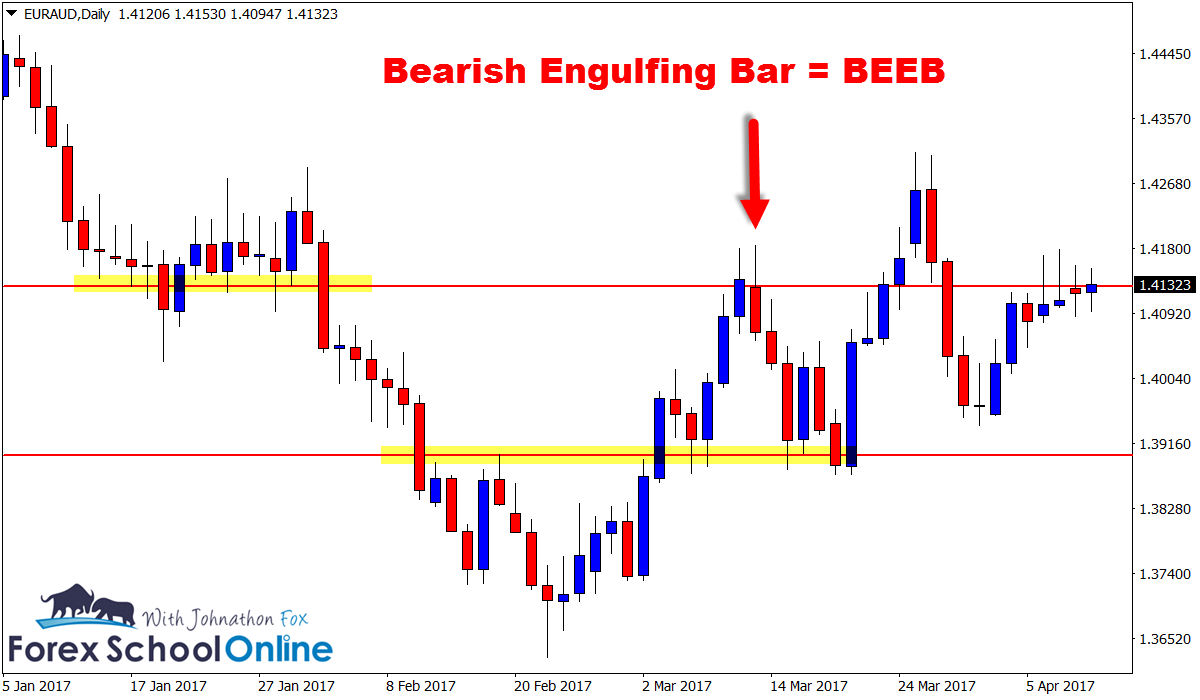
The other setup we discussed in the video last week was the EURAUD Daily chart and after price formed the Bearish Engulfing Bar = BEEB price sold off heavily and moved lower into the next major support level lows.
Daily EURAUD Chart

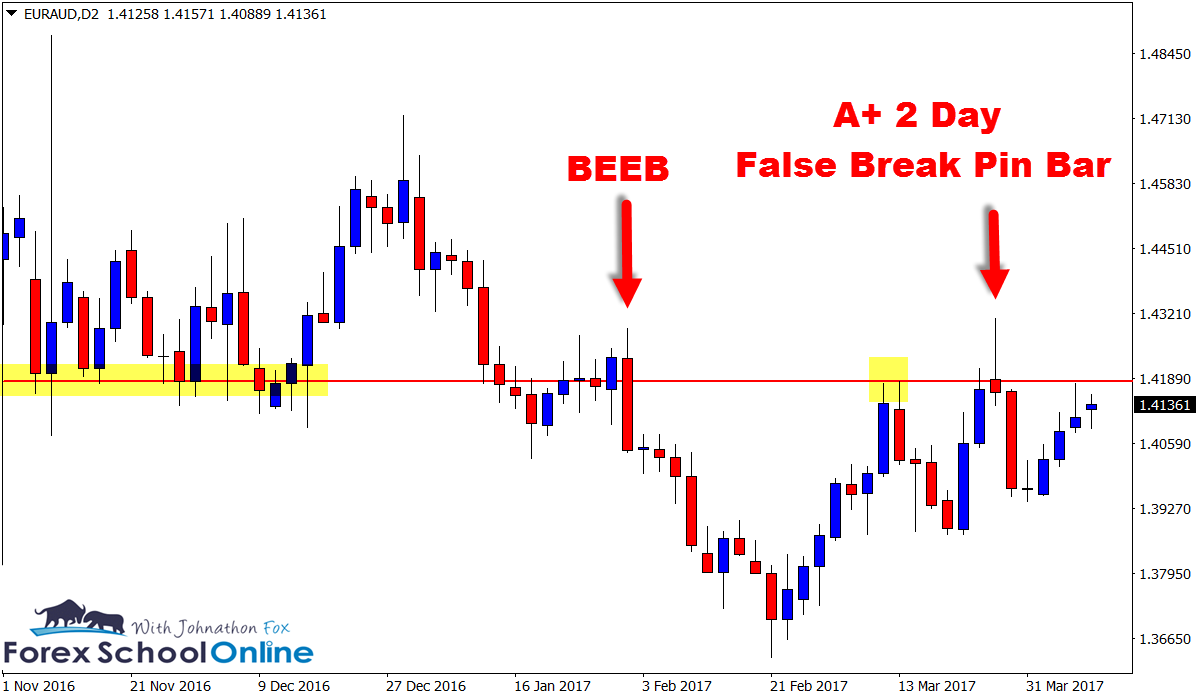
However, what is super interesting to note is the 2 day chart of the EURAUD price action and how price has continued on.
Check out the chart I have attached for you below and how price has formed another A+ high probability false break pin bar reversal at the major resistance level and again sold off lower;
2 Day EURAUD Chart

If you want to create any MT4 time frame charts yourself from 2 day / 8 hr etc, then get the indicator here and if you want to follow up on the money management lesson from the video then jump to;
Forex Money Management That Actually Works


Leave a Reply