A question I have been getting a lot lately is in regards to time frames. I personally trade starting at the daily chart right down to the 15 minute chart. What we need to realise though is that over the past 5-7 years the markets have changed a heck of a lot. The markets now are a lot slower than they use to be, and they don’t make the constant big volatile moves they did five years ago.
This has seen me move to smaller time frames over time. Price action can be read on any chart, it is just a factor of reading the different charts. I highly suggest you read my lesson on the time frames I recommend traders use, how traders start moving down the different time frames and the way that traders successfully step their way up to bigger and better things here;
Trading Daily Price Action Charts Down to the Intraday Time Frames
The 4 hour chart is a really great time for making entries, it is an in-between time frame. The daily chart is perfect for marking up levels and working out the major supply and demand levels (and also making trades). The smaller time frames, such as the 1 hour chart and below, can at times be really hectic and also choppy, but the 4 hour is just in the middle. Just like Goldilocks and the three bears with their porridge – not too long, not too short, just right!
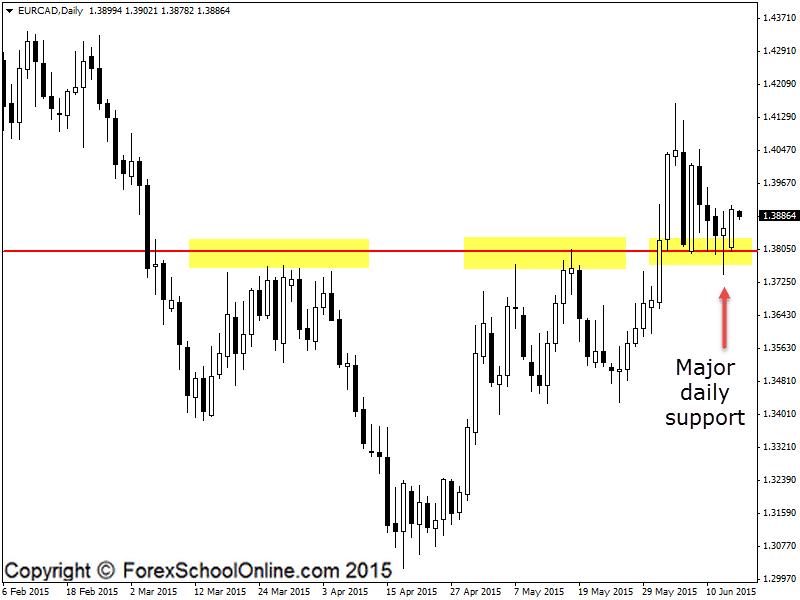
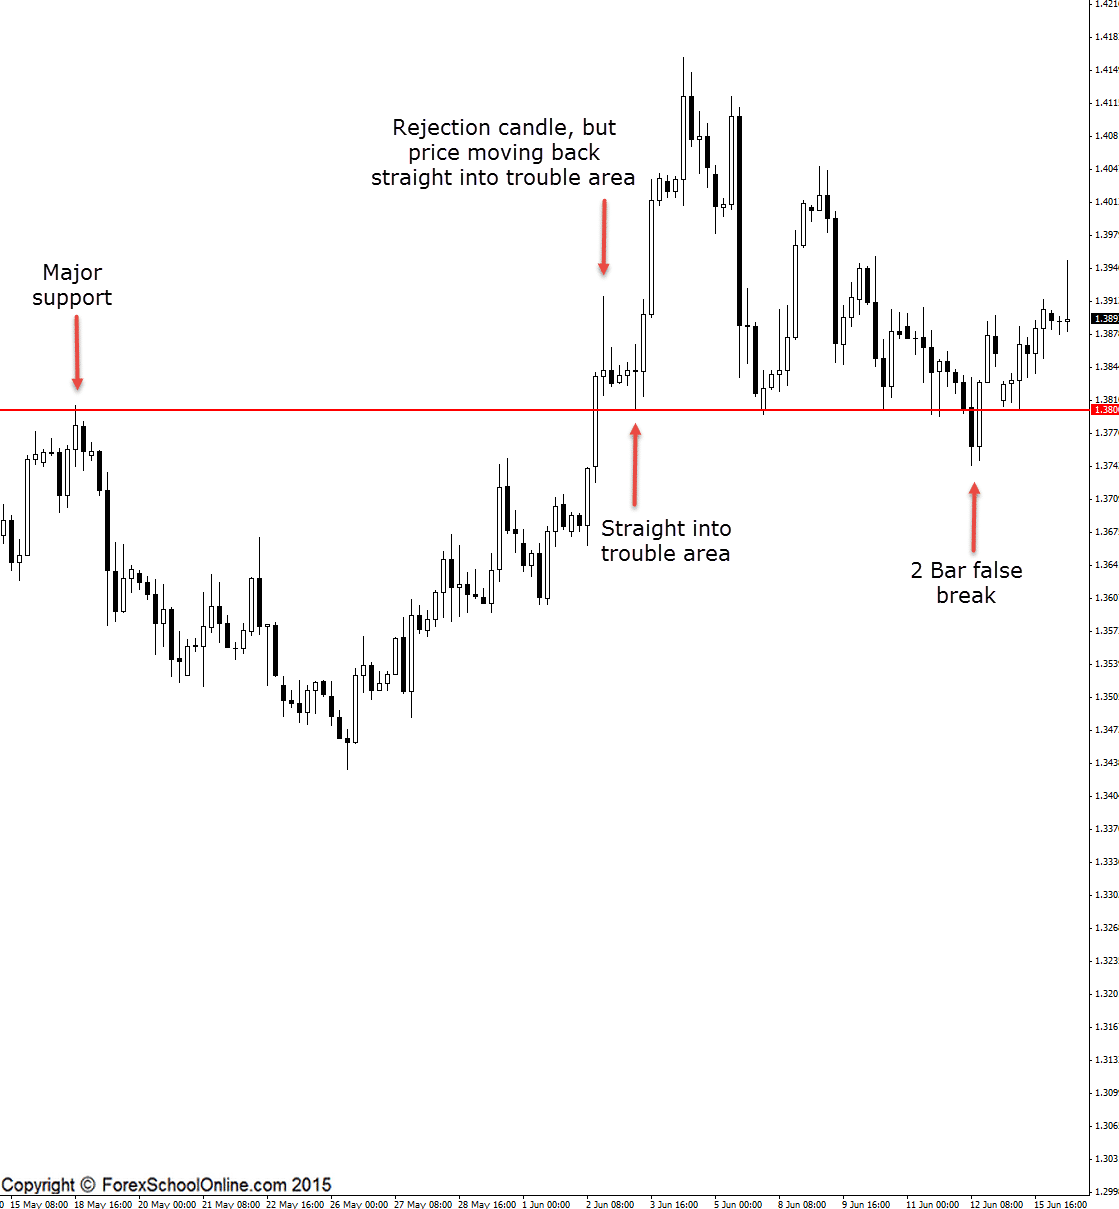
Below I have both the daily and 4 hour charts of the EURCAD. The level marked is the Round Number (RN) of the 1.3800 which as you can see on both charts is a major price flip level that has held as both a crucial support and resistance.
On the 4 hour chart we can see that price has made a large and obvious 2 bar reversal false break of the Round Number level snapping back higher and above the key daily level. This false break has sent price back higher. This is the way as traders we always want to be trading i,e away from the major daily levels. We never want to be trading into the big daily levels. This is something we need to keep in mind for our trade management.
If we compare the 2 bar reversal to the other bearish rejection candle that I have marked on the 4 hour chart, we can see that whilst the 2 bar reversal is making a false break and trading away from the key daily level, the bearish rejection candle is trading straight back into the major daily level. This would mean that if this rejection candle was a trigger signal and you were to enter it, you would be entering straight into the major daily support.
Always keep in mind with all time frames this key rule about trading away and not into the key major levels and this will help you have a much better chance of making high probability trades with much lower risk.
Daily Chart

4 Hour Chart


Leave a Reply