Lucky Block: August 16th
The LBLOCK looks prepared for upside gain. Applied indicators in this analysis are showing indications of an impending upward trend. Furthermore, Traders need to take advantage of this build-up, to maximize profits.
Current Value of LBLOCK/USD: $0.0004211
Lucky Block Market Capitalization: $44.9 million
Lucky Block Systemic Supply: 40.77 billion
Lucky Block Total Supply: 99.6 billion
Lucky Block Coinmarketcap Position: #3060
Important Marks:
Top Levels: $0.0004211, $0.0004255, $0.0004300
Bottom Levels: $0.0004280, $0.0004240, $0.0004210

Lucky Block Price Analysis: LBLOCK/USD Signs of an Uptrend
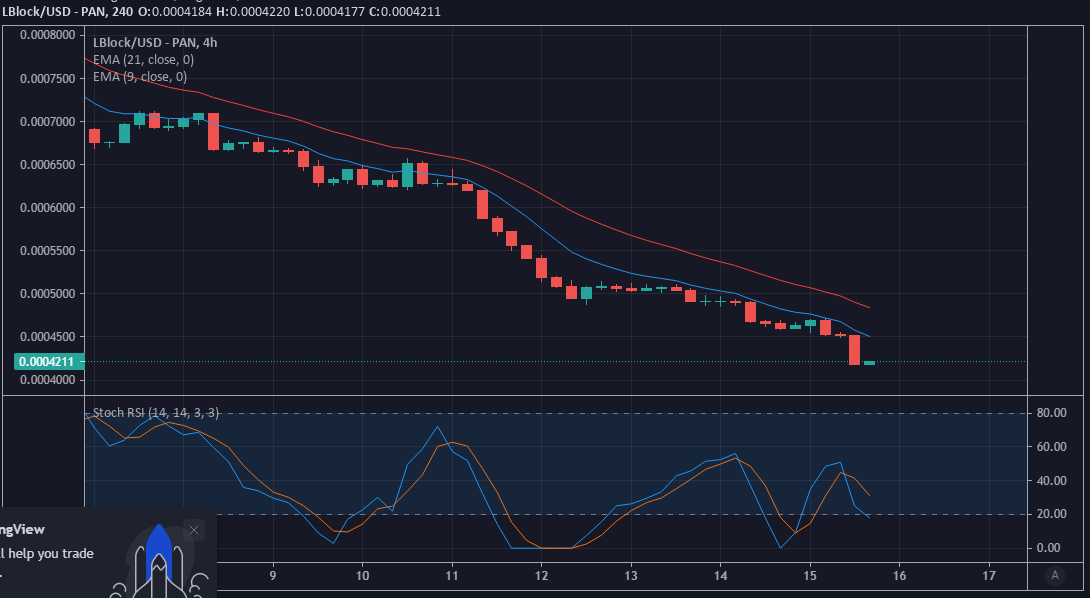
The influence of buyers is visible on the LBLOCK/USD 4-hour chart. The mentioned signs include the appearance of the most recent bullish candlestick, proximity of the 9/21-days EMA lines, and the Stochastic RSI reading. The closeness of the MA lines is telling that if volatility should set in on this market, Lucky Block may be propelled towards higher values. Also, the SRSI reading Portrays the impact of the buyers which resulted in the appearance of the latest bullish candle. Furthermore, it can be seen that the quicker SRSI line is making a bend towards the slower SRSI line. This activity may be portraying that an upward reversal is near. Once the aforementioned cross is completed LBLOCK may trade at $0.0004400 and above.

Lucky Block Value Analysis: LBLOCK/USD Impending Signs of Uptrend Becomes More Vivid
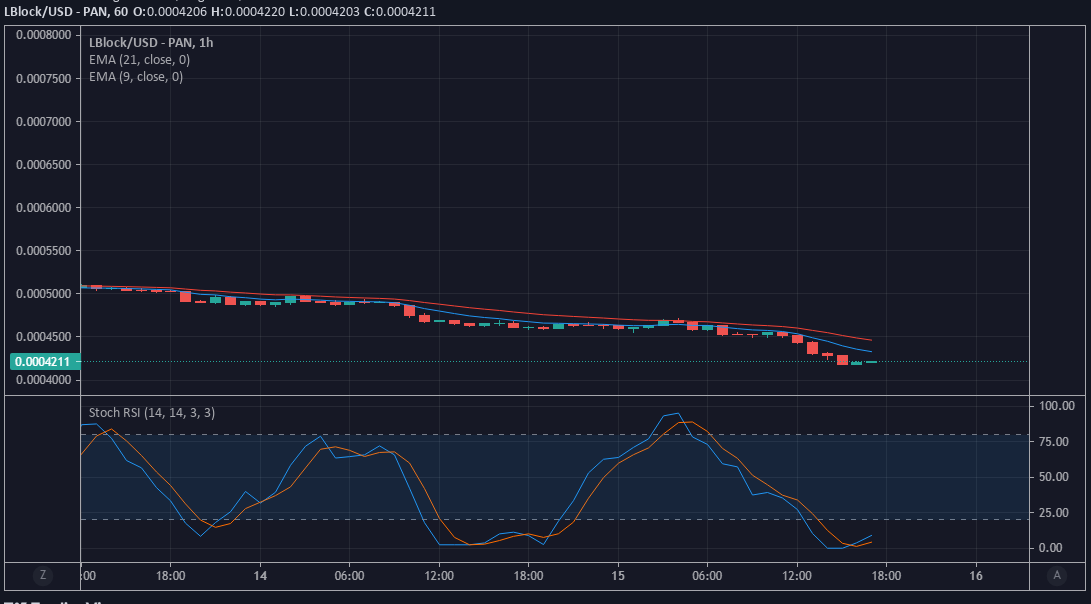
LBLOCK/USD 1-hour chart throws more light on the developing trend. On this chart, we can observe that the aforesaid uptrend has already begun. Also, two bullish candles have just formed on this chart, with one slightly higher than the other. Also, the SRSI lines have already crossed each other, and now it has commenced their movement in the upward direction. The implication of this is that the upside price correction is gaining power. Finally, traders should buy now, to catch the trend early enough.
You can purchase Lucky Block here. Buy LBlock


Leave a Reply