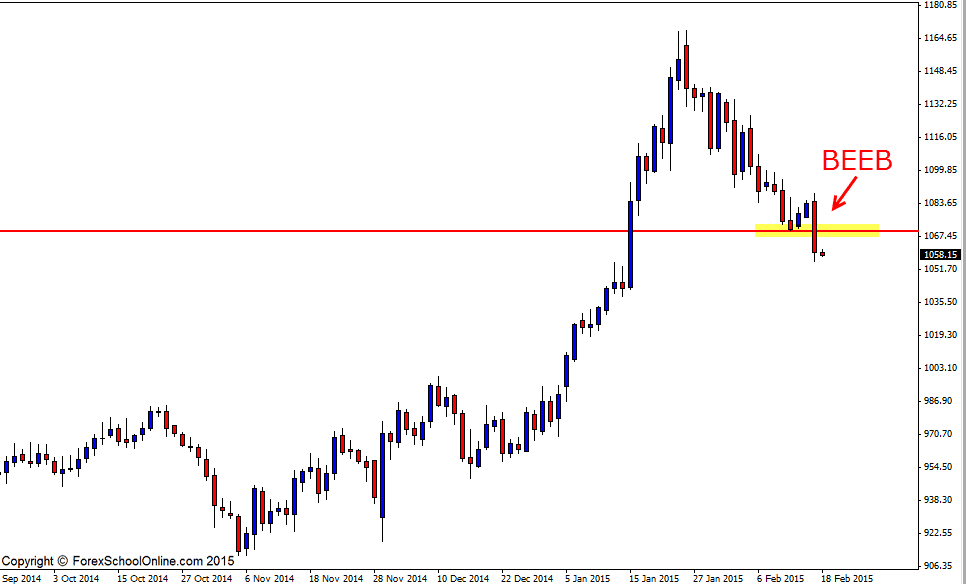
Price has formed a large Bearish Engulfing Bar (BEEB) on the XAUEUR Daily chart or the Gold v Euro chart. This BEEB is large and commanding and whilst it is not at a strong pull-back or place of value where we would like to see our reversal trigger signals, we can still use this price action information to read the chart and give us potential clues as to what price is looking to do next.
You will see that this Bearish Engulfing Bar is engulfing the previous two candles and that price closed strongly with the close being in the very last bottom 1/3 of the candle. Where price closes on engulfing bars is super important and can often be the difference of whether a setup is able to be traded of not.
For example; if a bearish engulfing bar has all the textbook makings for a high probability setup i,e it is up at a swing high, rejecting a major daily resistance, has lots of room to move into and is also a nice large bearish engulfing bar, it would be important where price closes. If this bearish engulfing bar closes in the top 1/3 of the candle, rather than the bottom 1/3 of the candle, then it would make it an unplayable setup simply because of how price closed. In this scenario price would have showed us that it closed very strongly with the bulls in control when we were looking to take a bearish setup and go short and for price to move lower.
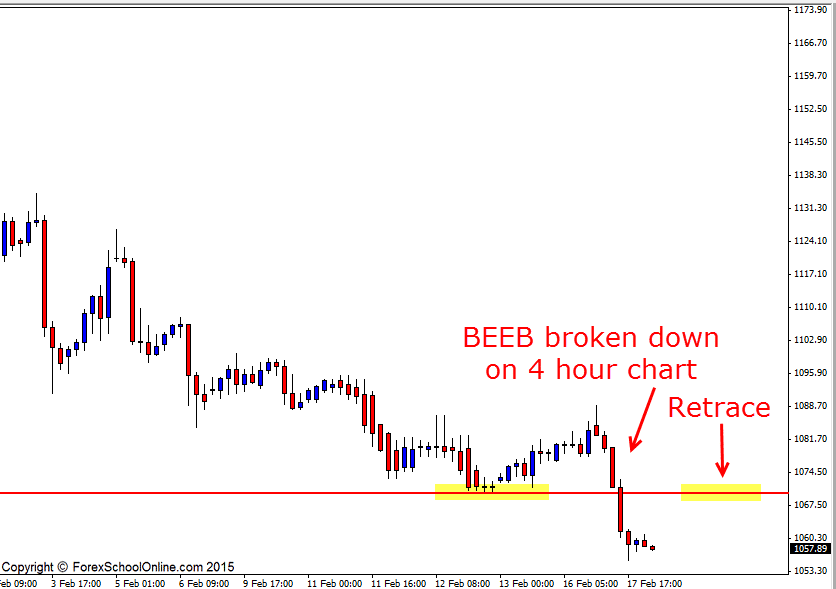
Now that price has printed off a BEEB in this market there appears to be two levels to keep an eye on. The first is the retrace level I have marked on the 4 hour chart below; If price can move into this level back higher, then this could be a really solid level to look for short trades on intraday charts such as the 4 hour or even 1 hour time frames.
The other level is the 1043.25 and this is the next major daily support. If price can break the low of the BEEB and gain some momentum, then it may be able to move into this next daily support area where you should keep an eye on it.
Gold v Euro Daily Chart

Gold v Euro 4 Hour Chart


Hello Johnathan
I want to know since you not use the indicators what do you use to see if the market is oversold or overbought?
Senzo
Hello Senzo,
We are reading the price action and the overall story of that chart to tell us when price is in a area of value to make a trade.
The overbought/oversold indicators are being made directly from the historical price on the chart right in front of us to give us some sort of reading so we are better off reading the live price as it is being printed.
The other thing is once we understand the super common market principles that repeat themselves we can learn to carry these out over and over again. These will be things like trading with a strong trend over and over and over again and often in this situation we will be going directly against what an indicator would be suggesting, but it would be the high probability play.
Safe trading,
Johnathon