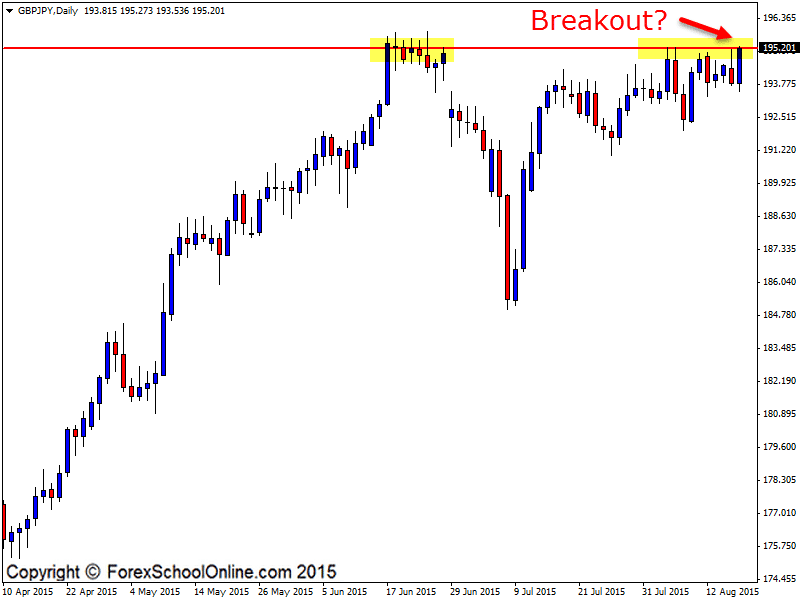
The GBPJPY is testing a major resistance level on the daily price action chart as I write this daily Forex trade setups commentary. After pushing strongly higher in the recent two weeks, price paused before now making another attempt to try and crack through this super strong resistance that has held price from making further legs higher.
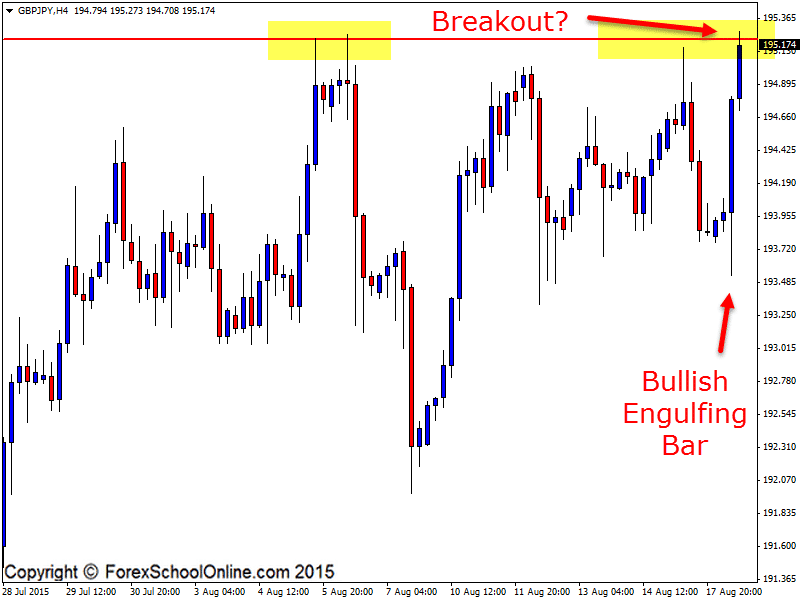
As the 4 hour chart shows below, there was a quick sideways movement or pause to build momentum or price action order flow before price started this new attempt at breaking out higher, kicked off by the 4 hour Bullish Engulfing Bar (BUEB).
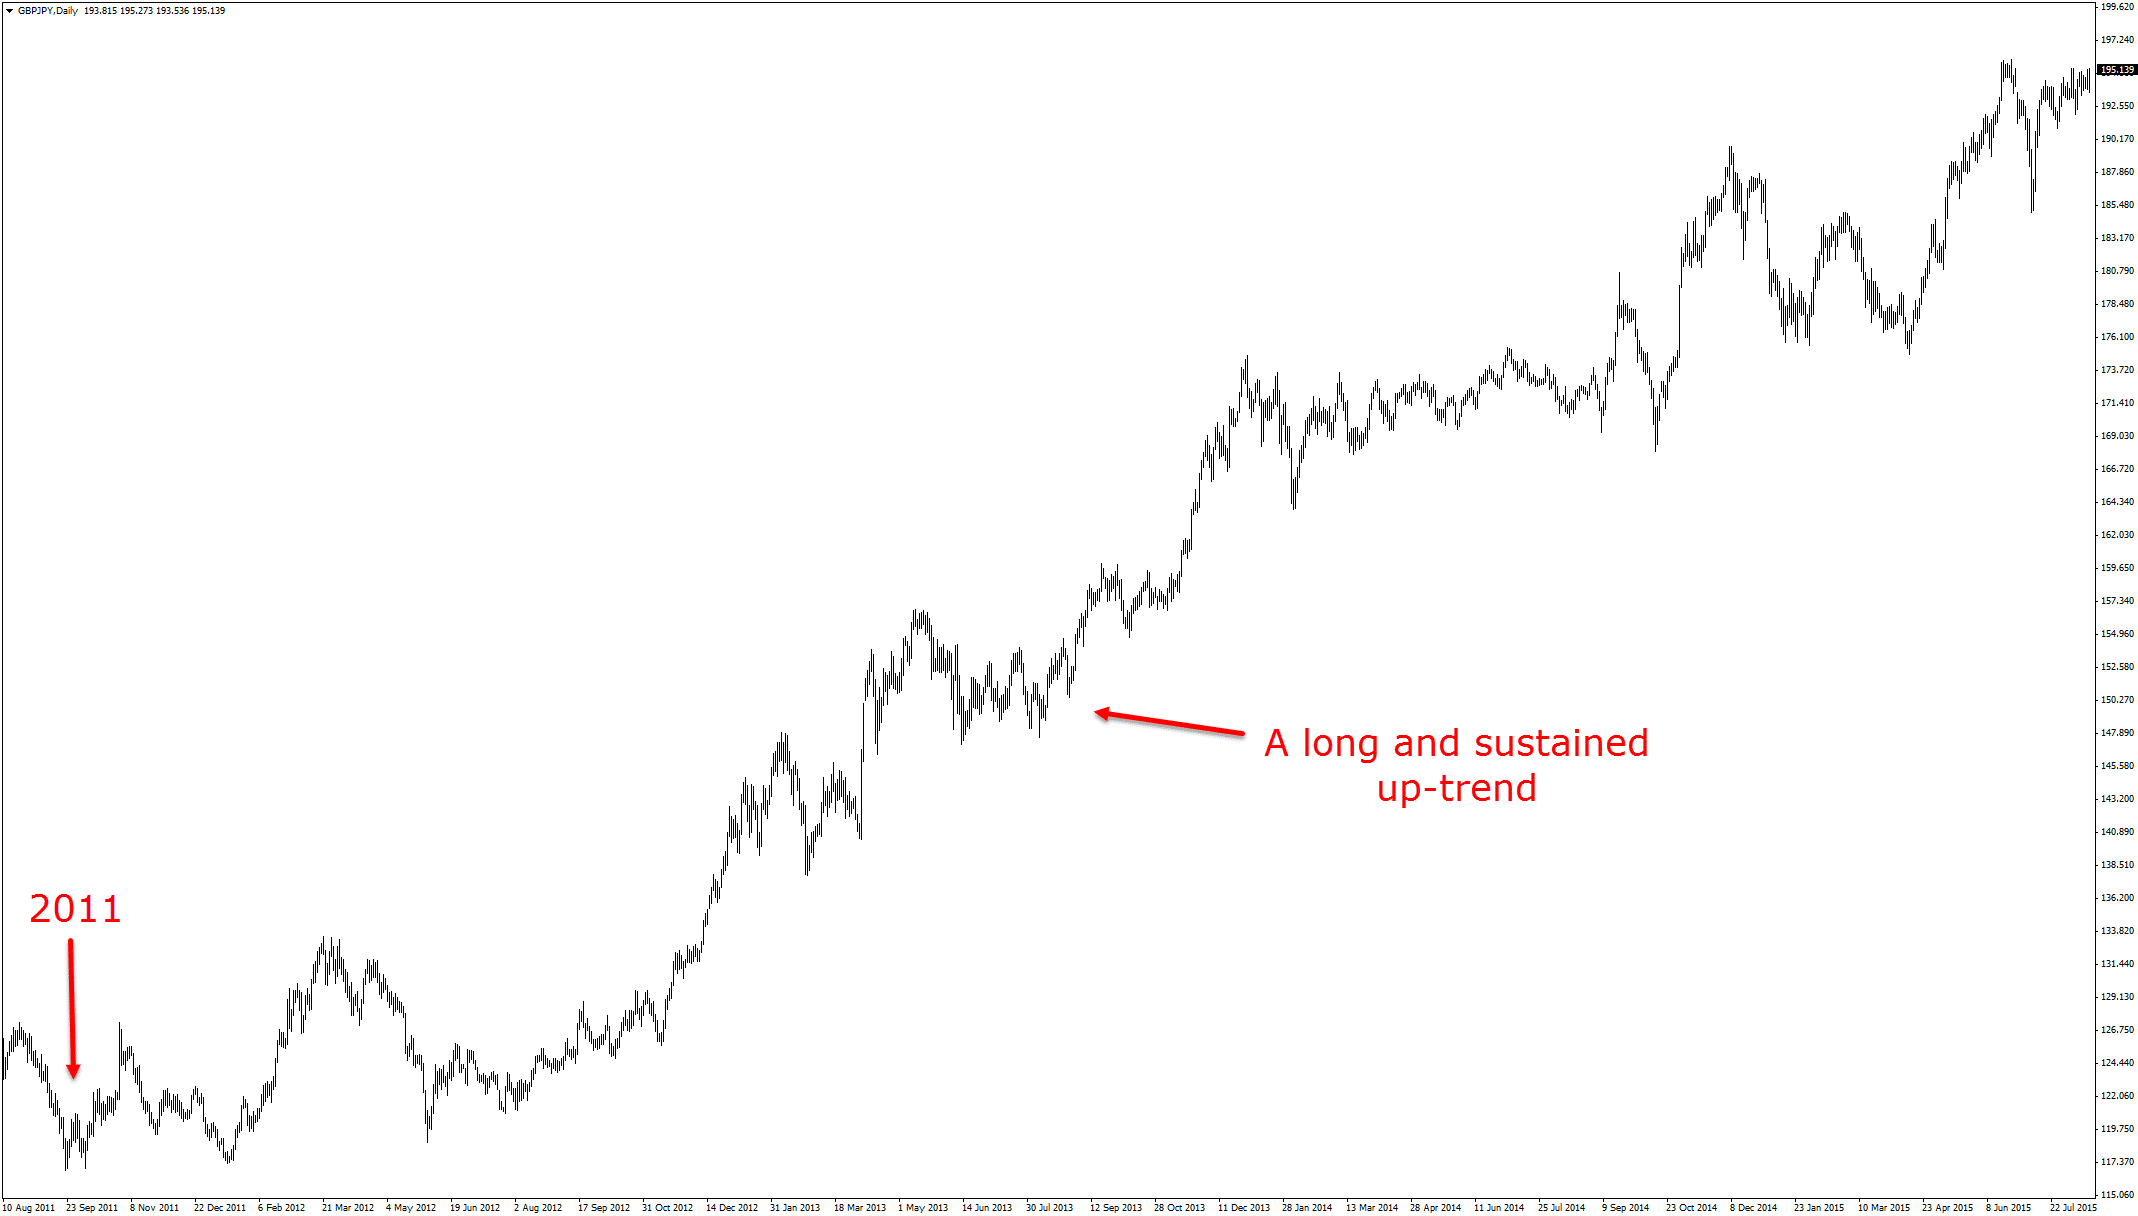
If price can breakout higher and move into fresh highs, then price would be moving into levels that have not been seen since September 2008. This would obviously be super significant for this market. As the zoomed out daily chart shows below, price has been moving higher in an up-trend for a very long time now and this breakout would be yet another confirmation of this trend continuing.
What does this mean for you and how can you look to play this market with price action? If price starts to breakout higher and through the major daily resistance level, then you need to be on your toes and watching for key price action clues for what the market is looking to do. I have a really high probability trading strategy I like to use in these scenarios that you can read about and use here:
Making High Probability Trade Setups With the First Test Support or Resistance
Once you notice price breaking out higher through the key daily breakout level, then you can start to move to your smaller intra-day time frames, such as the 4 hour, 1 hour, or potentially even smaller time frames. On these time frames, you are going to look for price to make a quick retrace or pull-back into the old breakout area where you will then look to get long with the breakout.
It is super important that you are watching the price action clues and that you make sure the breakout area has held as a new support. You also need to make sure that you confirm any potential trade setups by entering with high probability trigger signals, such as the ones taught in the Forex School Online members courses.
If price rejects the resistance and moves back lower, then you can trade this market as a normal sideways and ranging market with the first near term swing support coming in lower around the 192.30 level.
Daily Chart

Daily Chart – Zoomed Out

4 Hour Chart

Related Forex Trading Education
– Making High Probability Trade Setups With the First Test Support or Resistance


Leave a Reply