The inverted hammer is also known as the inverted pin bar and can catch out many new traders who are trading it in the incorrect way.
Whilst the standard hammer signals a potential reversal back lower, the inverted hammer signals a new move back higher. This can trick a lot of traders.
In this post we go through exactly what the inverted hammer candlestick pattern is and how you can use it in your own trading.
What is the Inverted Hammer Candlestick Pattern?
The inverted hammer candlestick pattern is a bullish reversal pattern that signals price may be about to make a new move back higher.
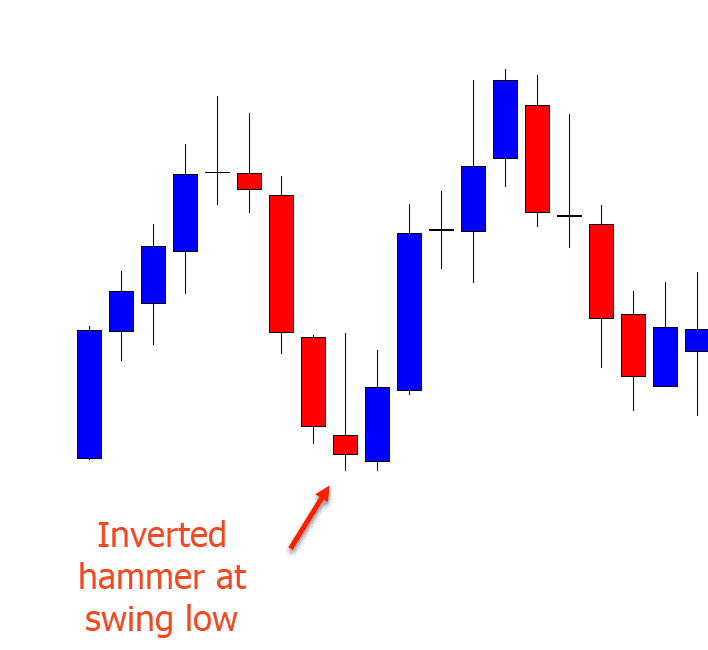
The key to this pattern is that it must form down at a swing low.
The reason the inverted hammer tricks so many traders is because if you looked at a normal hammer and an inverted hammer by themselves they would look the same.
The only difference between the two patterns is where they form. This is incredibly important because they signal completely different things.
Whilst the inverted hammer is signalling a potential new move back higher, the normal hammer is signalling a potential reversal back lower.
The inverted hammer forms down at a swing low, but the normal hammer forms up at a swing.
You will also notice that the normal hammer is normally out and sticking away from the other surrounding price action. The inverted hammer is in and stuck back around the surrounding price action.
How to Identify the Inverted Hammer Candlestick Pattern?
The inverted hammer looks the same as a normal hammer pattern, only it forms at a different area.
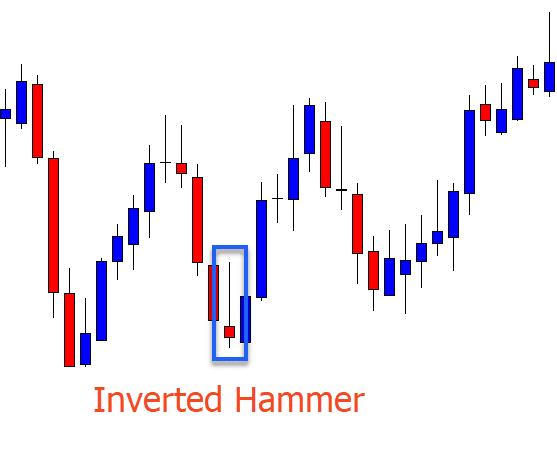
To identify an inverted hammer pattern you need to see a long upper candlestick wick or shadow and a small candlestick body.
As the example shows below, the inverted hammer is formed down at the swing low and the upper shadow points back higher.

Is the Inverted Hammer Bullish or Bearish?
The inverted hammer is a bullish reversal candlestick pattern. This pattern signals that a new reversal back higher could soon be on the cards.
As we have mentioned; the key is to make sure you are identifying the inverted hammer pattern when price has moved lower and into a swing low. If price does not move into a swing low first, then the trading pattern is not an inverted hammer and is a standard hammer. In this case it is signalling the complete opposite.
How Do You Trade the Inverted Hammer Pattern?
The best way to trade the inverted hammer pattern is to combine it with other market confluences to increase your trades odds.
These other confluences could be looking to trade inline with the overall trend, or looking to use major support levels.
An example of how you could do this is looking for price to move lower and into a key support level you have already marked out as a level you want to find long trades.
When price moves into this support you could then start watching for a potential inverted hammer pattern to form. If you see an inverted hammer pattern form at this support level you could then look to enter your long trades.

Where to Set Stops and Profit Targets
Setting profit targets and stop loss levels on the inverted hammer pattern is pretty straight forward.
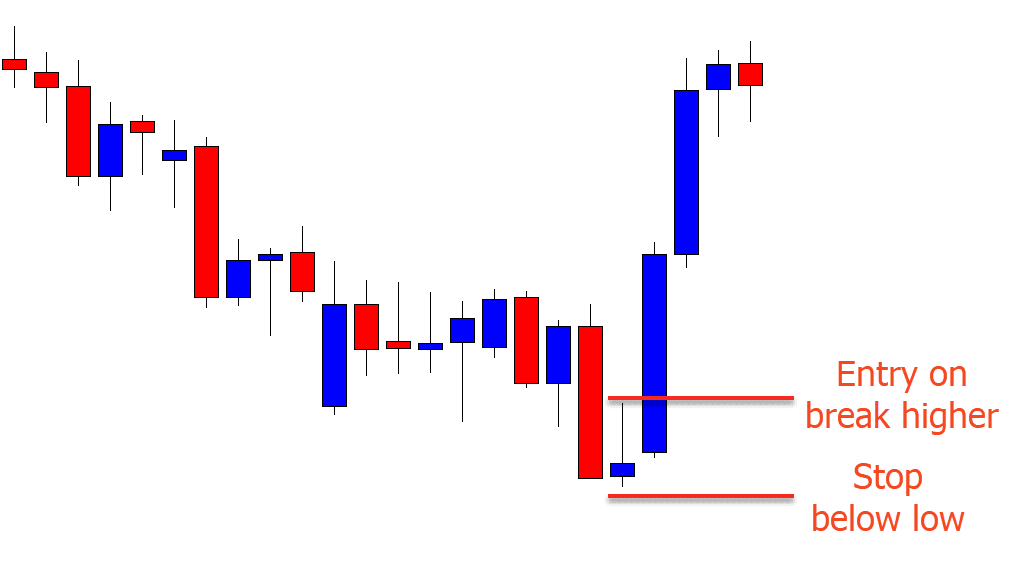
The key to making an entry with this pattern is where price breaks with the next candlestick after the inverted hammer has been formed. You want to see price break and make a strong move higher. With this in mind you could set your trade entry for when price breaks the high of the inverted hammer candlestick.
To do this you could use a pending buy stop order that would trigger your trade automatically if price moves higher into your trade entry.
You could place your stop loss below the low of the candlestick pattern. Using this level as a stop would ensure that you give your trade plenty of room to move and also enough chance to go onto become a winning trade. It would also allow you to have a short enough stop that you could make a decent risk reward on a winning trade.
See the example below; the entry is taken when price moves higher and the stop loss is placed below the candlestick low.


Leave a Reply