USDSGD DAILY CHART HUGE TEST SUPPORT
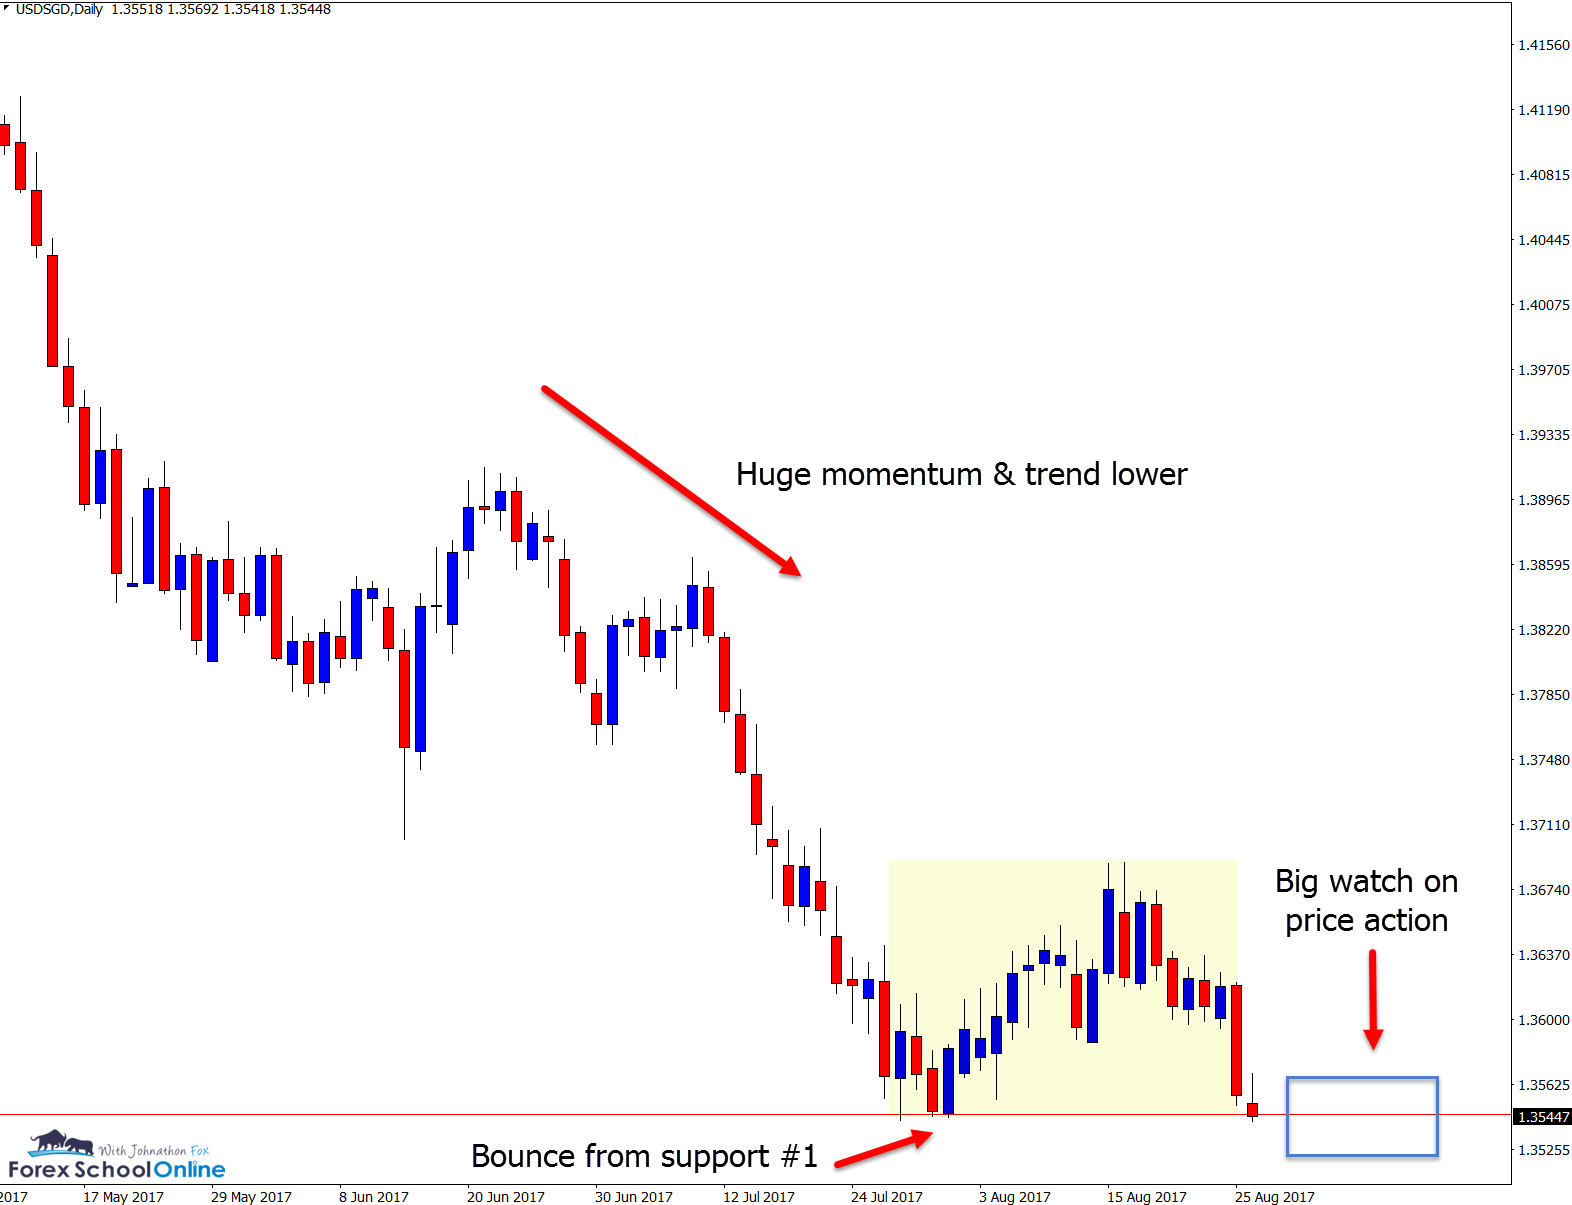
Price is making a MAJOR test of the daily price action key support level on the USDSGD as I write this charts in focus post for you right now.
As you can see on the chart below; price has been pushing lower with strong momentum and has already made a strong test of the daily support level with price snapping strongly back higher.
As I have taught in-depth in this lesson here; How Price Action Market Reversals Are First Created
One of the very first reversals signs we see in a market is when price makes either a base or a top, just like we may potentially be seeing here with price forming the first test of support, then the consolidation box / sideways movement and now another follow up re-test.
It is this follow up test that is crucial. It is here that the bears or sellers are now looking for the trend and momentum to continue and the market to roll back over once the bulls and buyers have been cleaned out. They are looking for price to break below after all of the buyers in this market have finally been sucked out.
A trend and market will reverse when the bulls or bears (bears in this case) will have one final attempt to continue their trend and fail, and then very quickly be overrun in the opposite direction in this case back higher.
This major level support will be crucial and important to watch in following sessions. If price breaks lower, then we can continue hunting short trades, but if the sellers / bears fail we have a potential market reversal to watch in play.
Daily Chart USDSGD

GBPCAD DAILY ENGULFING BARS
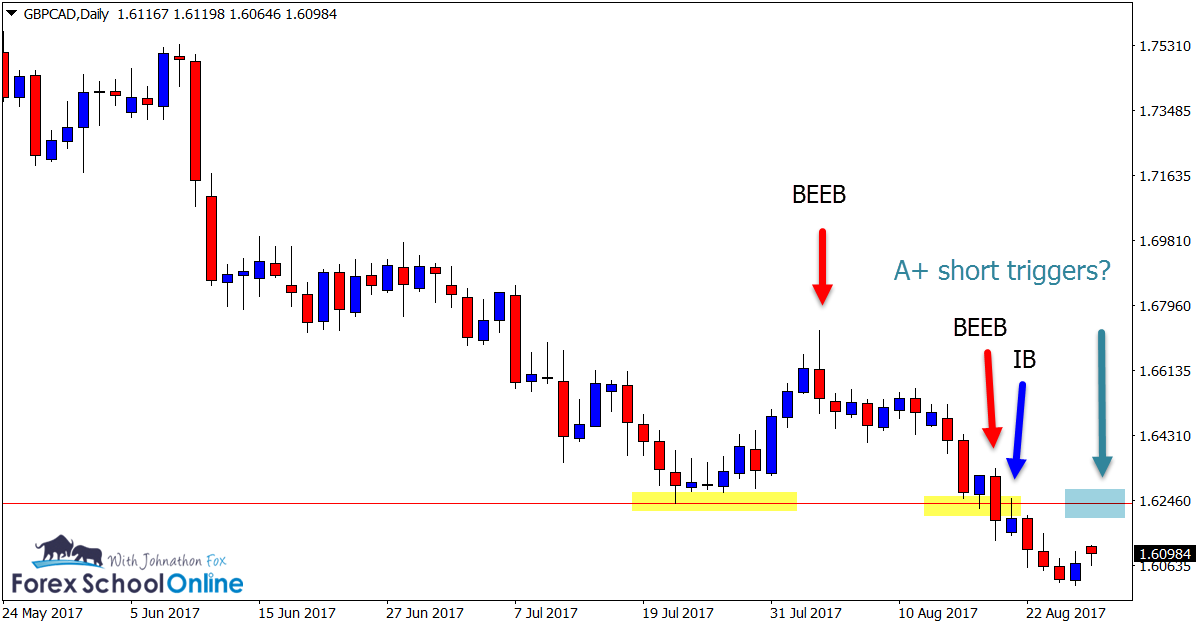
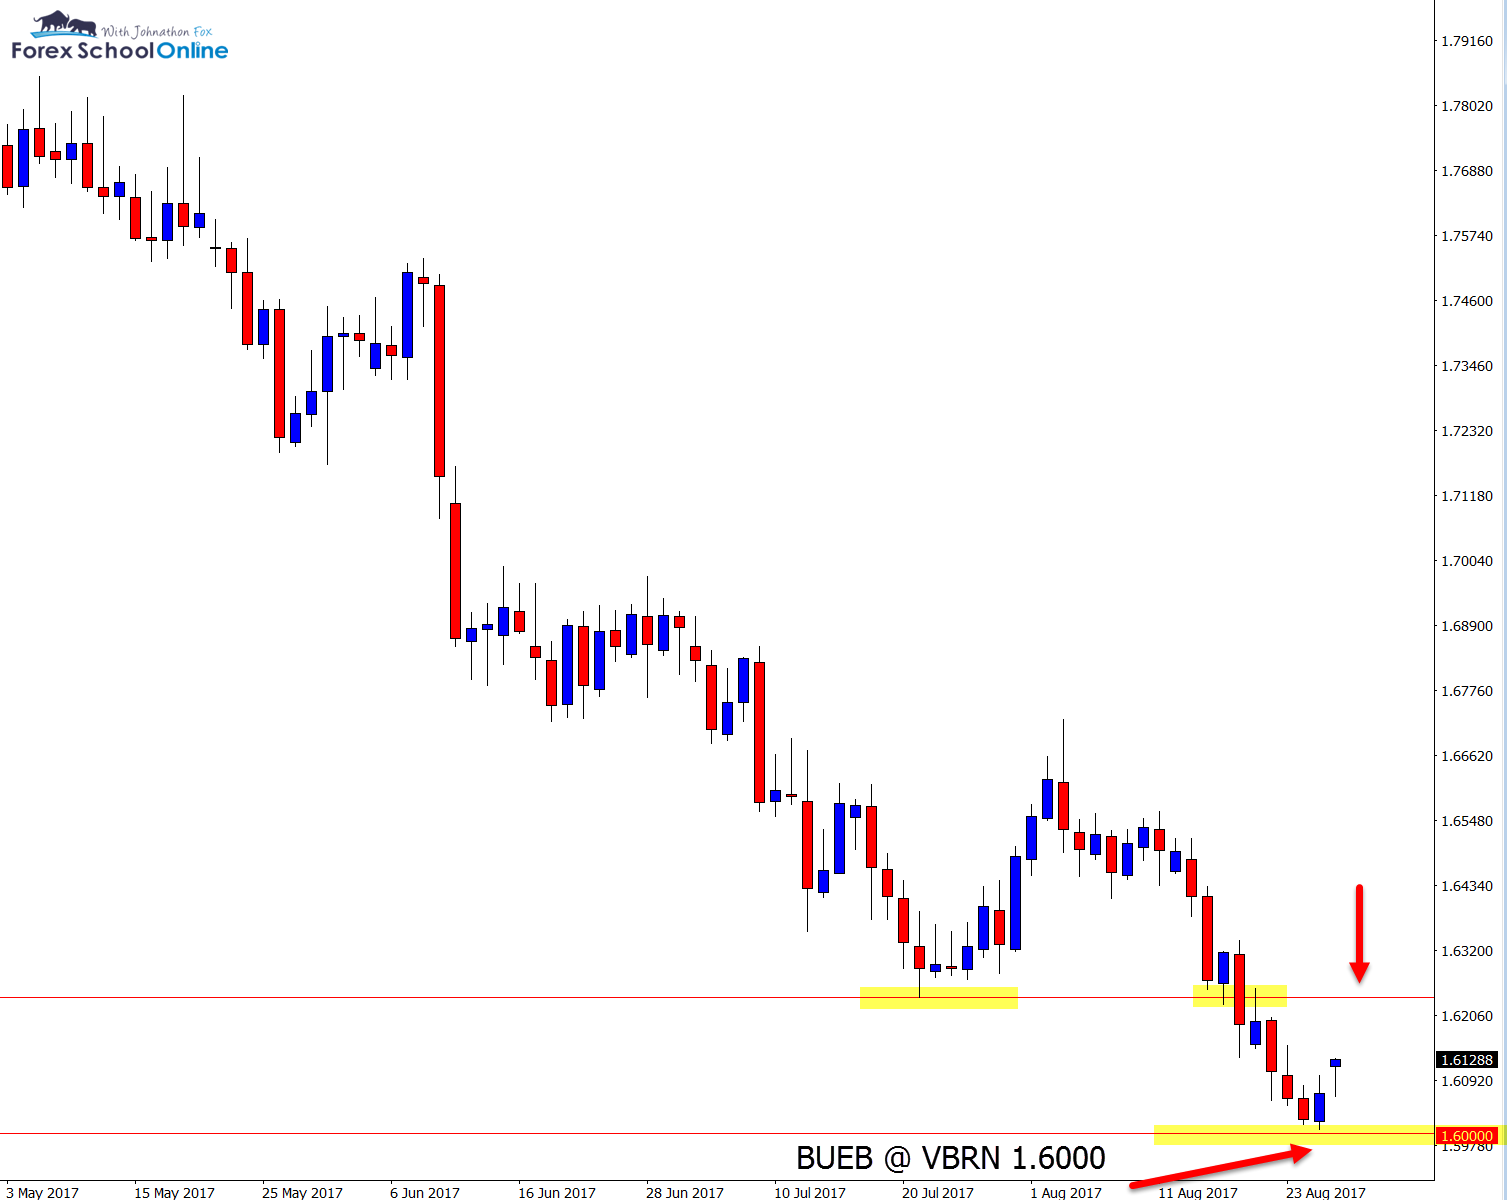
Price was started lower in this pair by a Bearish Engulfing Bar – it then broke a major level with a Bearish Engulfing Bar = “BEEB” and has now rejected a Very Big Round Number = “VBRN” 1.6000 with…. A Bullish Engulfing Bar!
This market has a really strong overhead resistance that if price can continue moving into off the back of this Bullish Engulfing Bar = “BUEB” it could act as a potentially high probability level to hunt short trade setups.
Looking for short trades at this level on either daily or smaller time frames would be inline with the recent momentum and at a major daily level, making sure to confirm with A+ trigger setup.
Read: How to Hunt A+ Price Action Trade Setups at Kill Zones
Daily Chart GBPCAD

Daily Chart GBPCAD


Leave a Reply