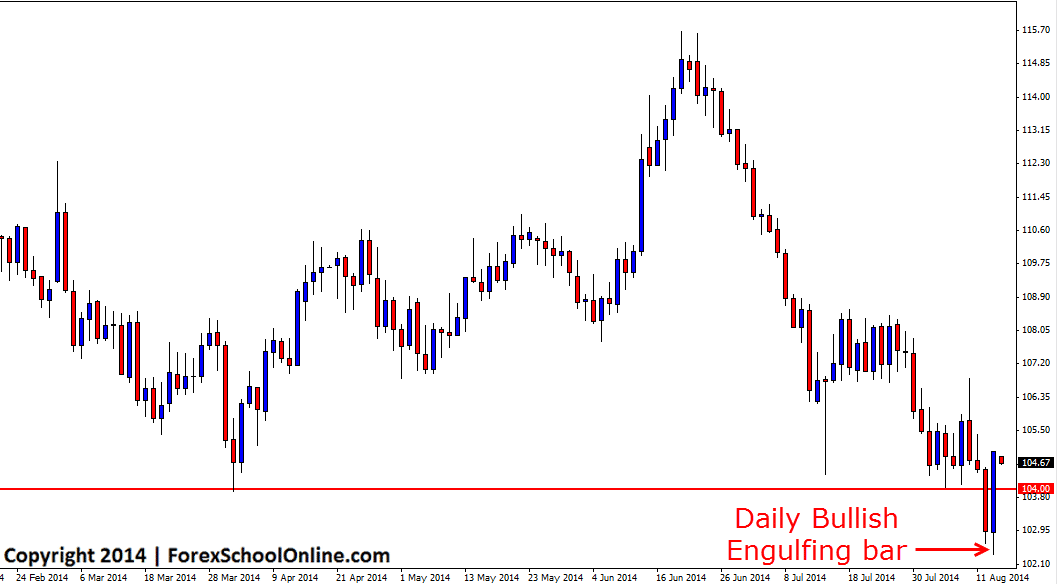
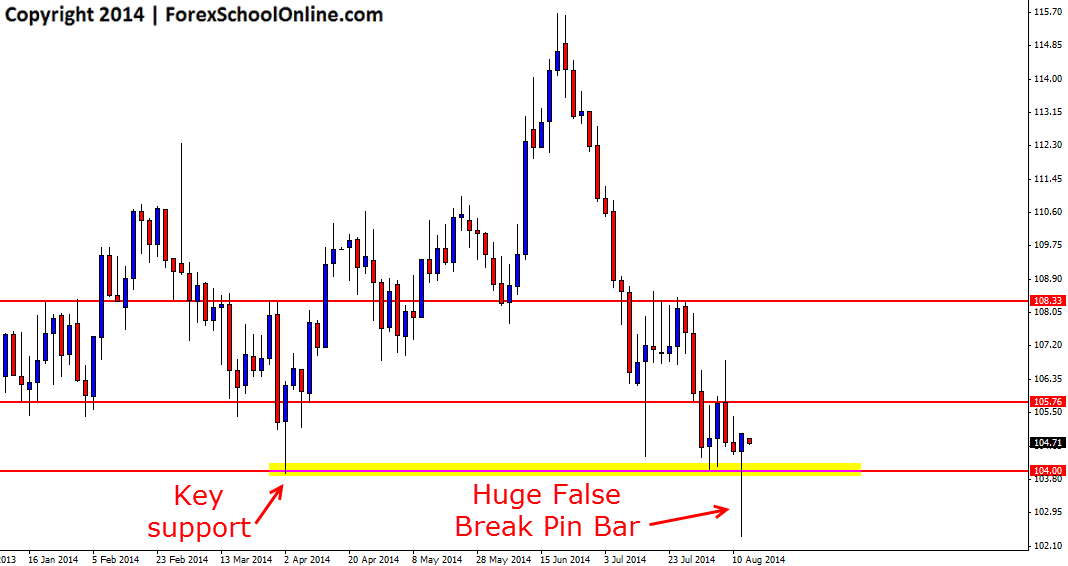
The price action in the Spot Brent Crude Oil market has printed a huge false break pin bar on the 2 day chart. Price on the first of the two days tried to make a break lower and as the daily chart shows below; price closed strongly lower. Then on the daily chart, price snapped back higher and created a Bullish Engulfing Bar (BUEB) with a strong close back higher with the close towards the high of the session.
When combining or blending these two daily candles together which I teach how can be done in the trading tutorial How to Blend and Change MT4 Candle Time Frames price comes together to form a huge false break 2 day pin bar which can be seen on the 2 day chart below. This pin bar is making a clear false break of the recent support and Round Number (RN) of 94.00 which has acted as a clear level of importance in recent times.
If price can manage to break the high of this 2 day false break pin bar and make a break higher, there is a near term resistance just overhead around the 105.75 area. If price can break this level, then there looks to be space for price to move into. The first level for price to contend with if it moves back lower is that round number and support just discussed around the 94.00 level. If price falls back through this level again it may look to make a move lower.
Daily Brent Crude Oil Chart

2 Day Brent Crude Oil Chart


Leave a Reply