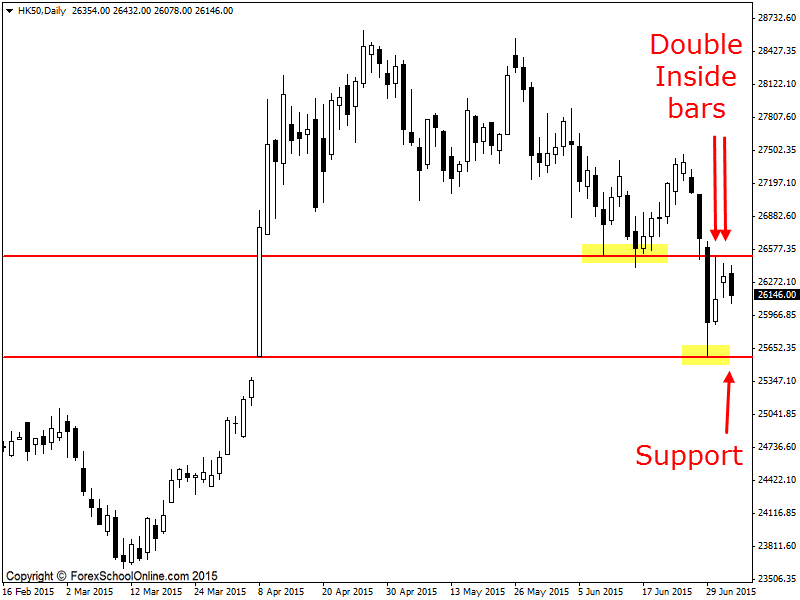
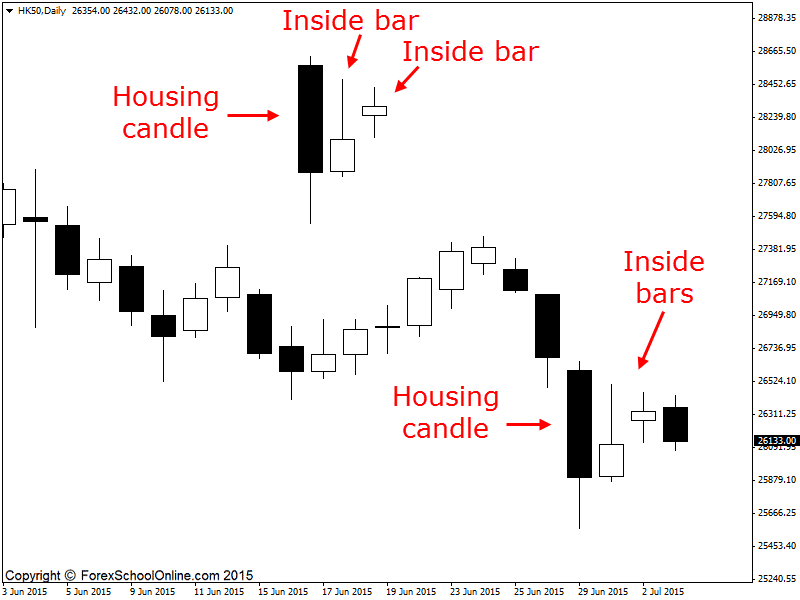
Price has formed back to back inside bars or what is often referred to as double inside bars on the daily price action chart. When price forms double inside bars with one after the other and price is winding up having smaller highs and lows, it is a classic clue that price is building for a breakout.
The breakout often comes in the same direction price has just been either trending or strongly moving in. For example; if price has recently been in a strong trend higher and then it goes into a windup period, there is a very high chance that when price does breakout it will breakout higher in that same direction price was previously trending.
Why is this the case? Quite simply because of the order flow price action and the supply and demand behind the scenes that is going into creating the moves. What is normally happening is that price in a strong trend has one team in control. For example; if price is trending higher, then the bulls are in control of the market. Eventually price pauses, but during this pause the bulls are still in the overall control.
Eventually after the pause the bulls will take over the market once again with their weight of numbers and breakout of the consolidation or windup and price will resume in the same move that it was on before it moved into the sideways or windup period.
If we look at the Hong Kong 50 daily chart we can see that price has been making lower highs and lower lows in recent times. It has also broken a recent important support area before then pausing and forming these inside bars. If price can now break lower from the inside bars lows, there is a near term support I have highlighted on the daily chart below, but after that there is a little bit of space to move into lower.
HK50 Daily Chart

HK50 Daily Chart

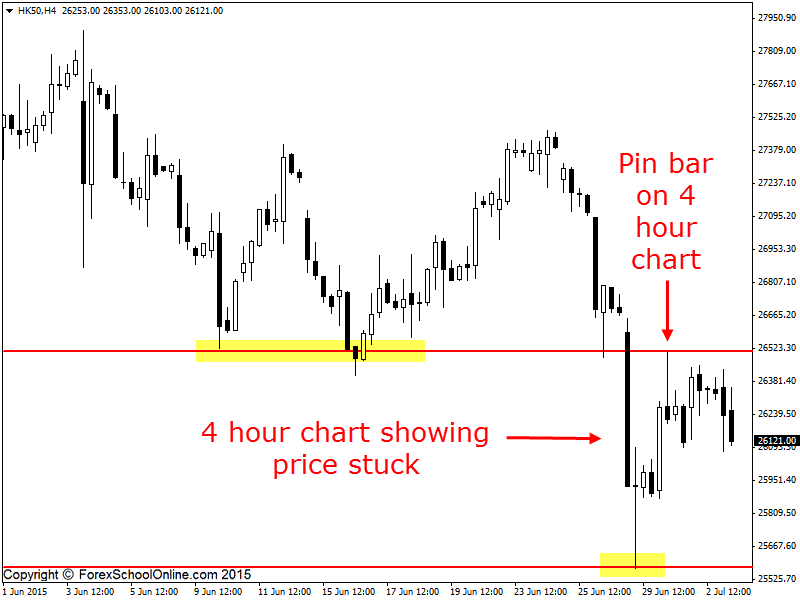
HK50 4 Hour Chart

Related Forex Trading Education
– The Recommended New York Close 5 Day Charts & Broker For Price Action Traders


Leave a Reply