In this blog on Forex trading setups & commentary I am regularly showing and teaching you where the value areas are to hunt for trades.
If you are a regular reader of the trade setups you will know that we often are highlighting the key value areas where price has either just broken out or where the best and most value would be for traders to hunt trades at a ‘pull-back’ or retracement in the market.
The reason I teach these and the reason I use them myself is because they are simple, but repeat time and time again and are something that come with a lot of market factors in it’s favor. When we are looking for a quick pull-back or retracement back into a major daily support or resistance after price has broken out or made a strong move, the two major factors we have in our favor are;
- We are going to be trading from a major price flip daily support or resistance level
- We are going to be trading with the momentum that price has made the recent push with – in other words; this will be in our favor.
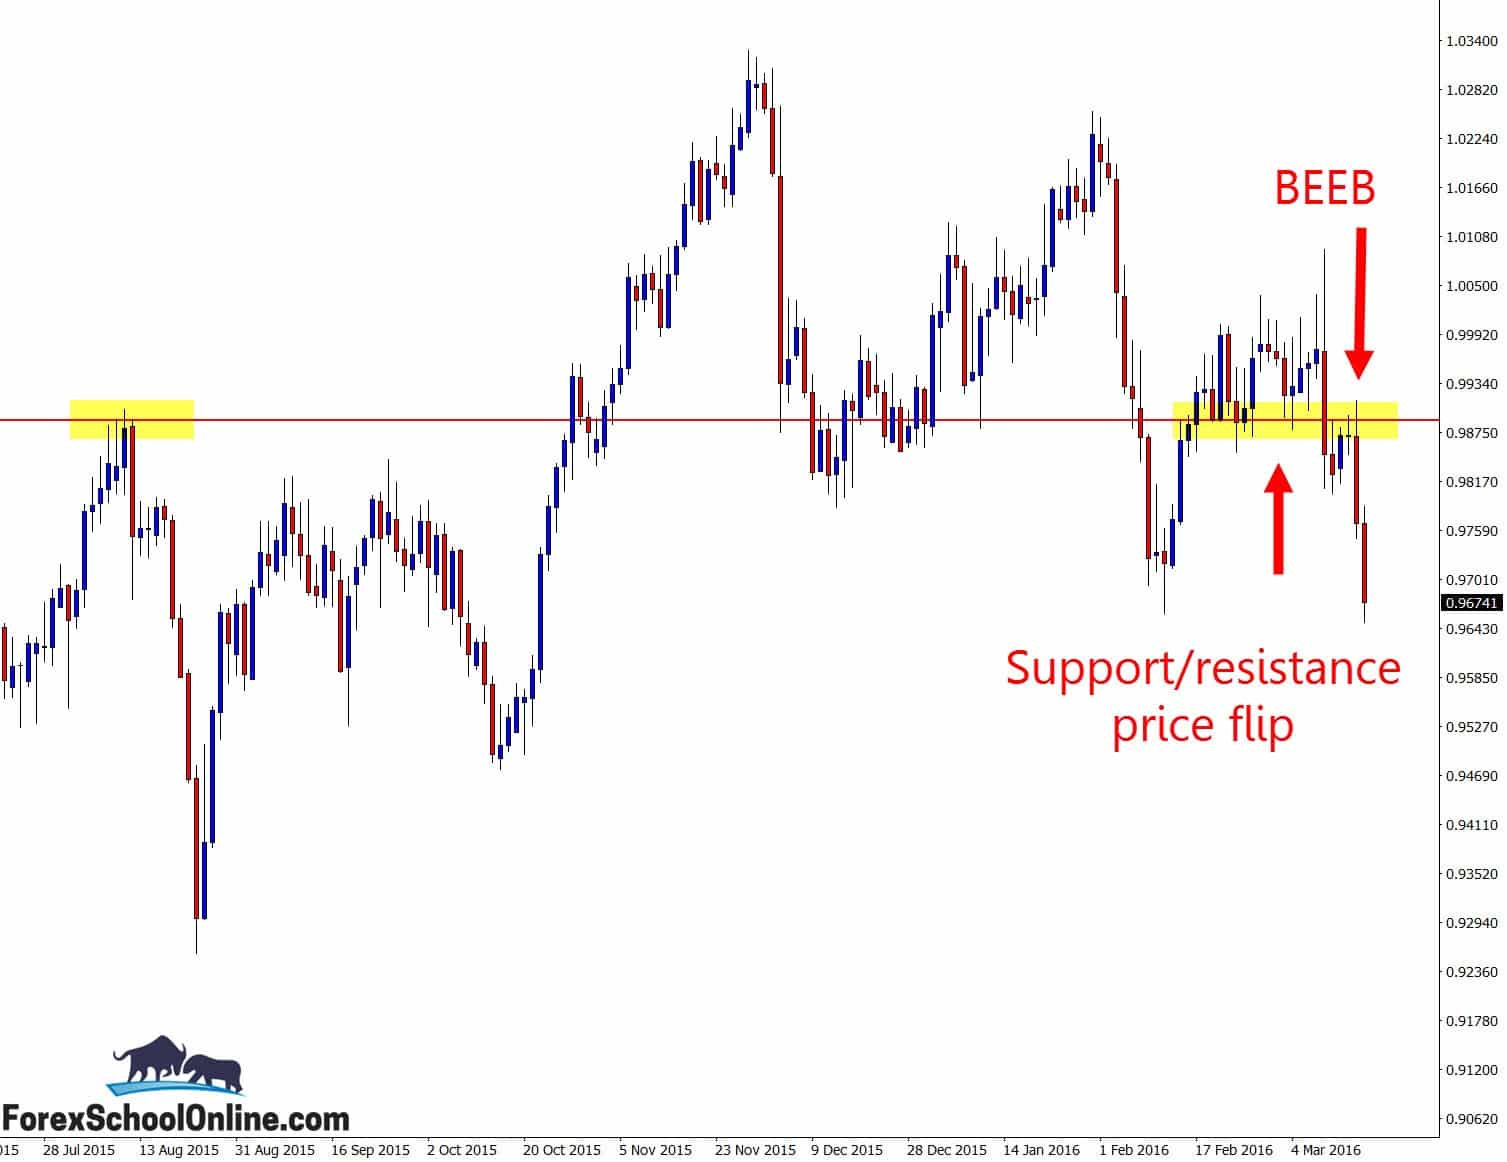
Price on the daily chart of the USDCHF has today made a large move lower on the back of a Bearish Engulfing Bar = BEEB. What was most important about this BEEB was where it formed in the market and the price action story.
As you can see on the chart below, whilst the engulfing bar formed in a range, price was pulling back and making a retracement back into a daily resistance level. Price had recently just smashed out and through this level and this engulfing bar was back at this level making a re-test and rejection. What is not shown on the chart below is how price is closing below a major daily support level with the BEEB.
If you want to learn more about hunting price action setups at value areas, checkout the lesson;
How to Hunt Price Action Setups at Value Areas
Daily Chart USDCHF – BEEB at Pull-back

Price on the daily chart of the USDCAD has also formed a Bearish Engulfing Bar, but this BEEB has crashed through to make a break lower and through the major daily support on this pair. See chart below;
This is an important level and if price can make a pull-back or retracement back into this level it could be a solid level to hunt for short trades. Traders could use this major level and the recent momentum lower and move to their intraday charts such as the 8hr, 4hr, 1hr or even lower to watch this level and see if it fires off any bearish trigger signals to get short.
With levels like these they don’t always hold and that is why it is important we use another layer in our favor and make sure we use an A+ high probability trigger signal to confirm any potential trade setups.
Daily Chart USDCAD – Value Area

Related Forex Trading Education


Leave a Reply