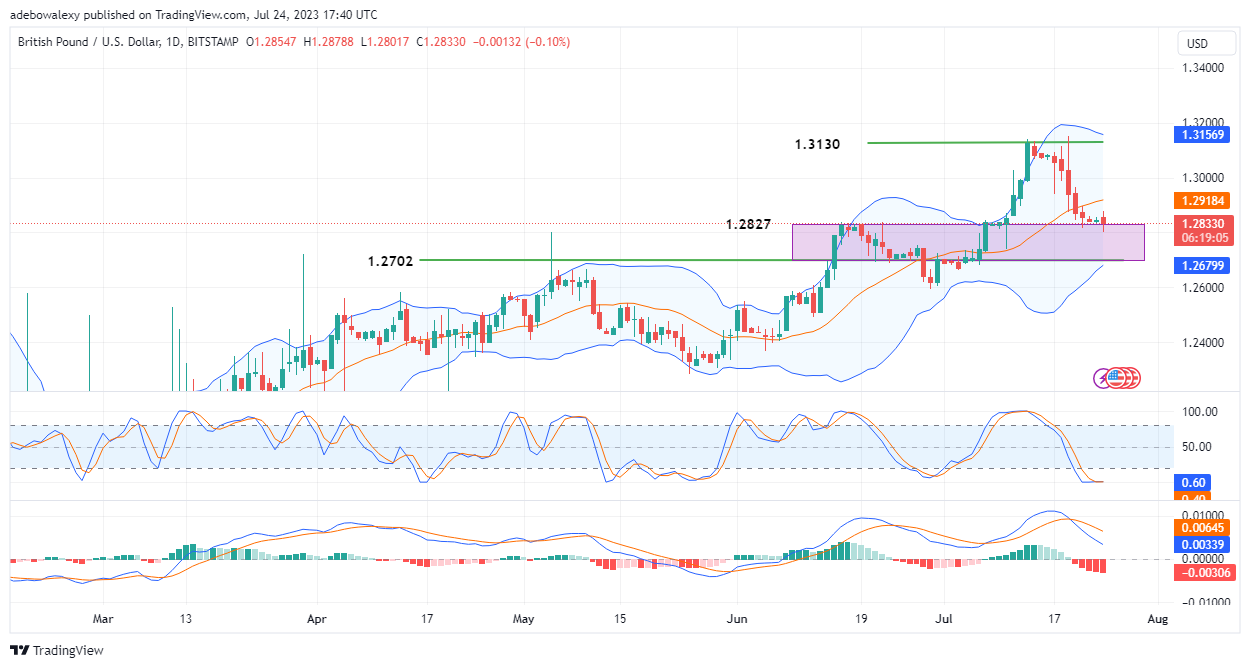
The GBPUSD pair faced a strong rejection at the 1.3130 resistance price mark. It appears that bulls in this market have turned tail as the US dollar’s mood began to improve. At this point, price action may be on the verge of breaking the support region between 1.2702 and 1.2827.
Major Price Levels:
Resistance Levels: 1.2850, 1.2900, and 1.2950
Support Levels: 1.2833, 1.2750, and 1.2700

GBPUSD Has Strong Downside Potentials
On the GBPUSD daily market, price action is displaying strong bearish characteristics. This can be further observed as price action has fallen below the middle limit of the Bollinger Bands. By implication, this suggests that bears are dominating. Bolstering this inference are the Relative Strength Index (RSI) and the Moving Average Convergence Divergence (MACD) indicator.
The lines of the RSI seem flat out in the oversold region, as their lines are now trending sideways after merging together. Also, the MACD curves are still falling toward the equilibrium level while their bars are still solid red. This indicates that downward forces are strong in this market.

GBPUSD Buyers Are Staging a Resistance
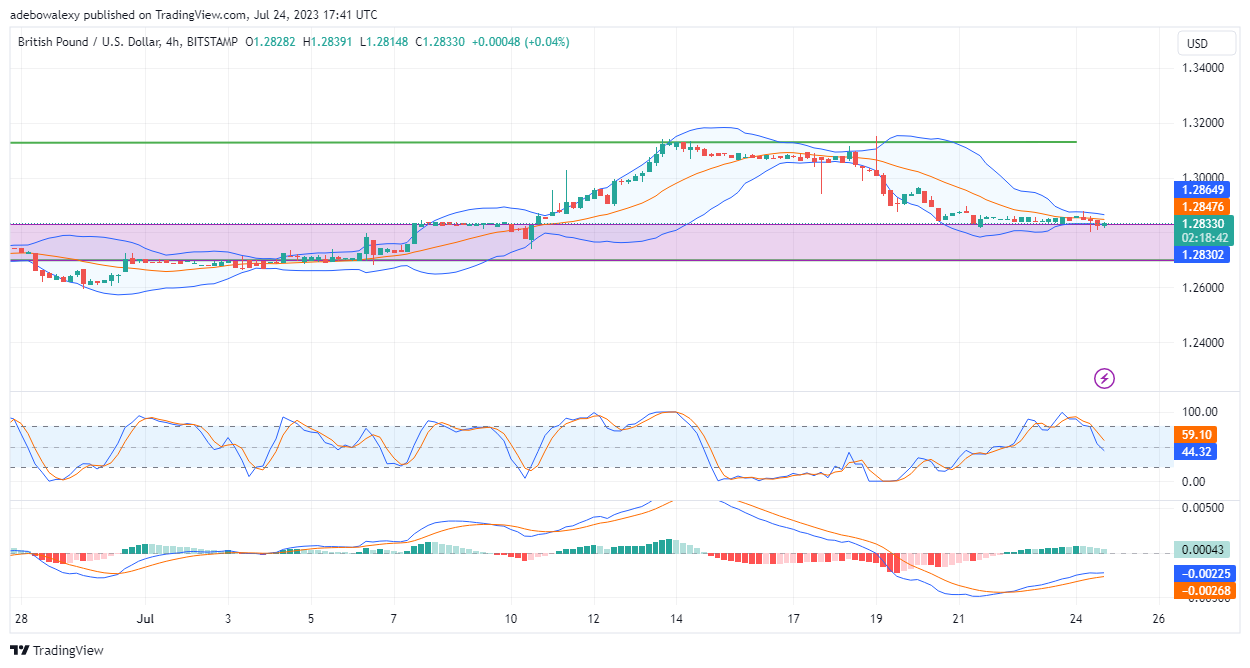
The GBPUSD 4-hour market is revealing that buyers are trying to resist further price declines. The last price candlestick on this chart seems to reveal that some traders are opening long positions. However, considering that alone, it will be insufficient to bank on. Meanwhile, the Bollinger Bands are now contracting, which seems to indicate that a significant price move is on the way.
Nevertheless, the RSI lines continue to fall in the direction of oversold. Likewise, the MACD is also showing that the developing upside momentum is still weak. This inference is drawn from the appearance of the MACD bars. Therefore, it’s more likely that the staged resistance against the headwind may fail and the price will continue to approach the 1.2700 mark.
Do you want to take your trading to the next level? Join the best platform for that here.


Leave a Reply