What is the Head and Shoulders Pattern
The head and shoulders pattern is a very popular reversal pattern.
With this pattern you are looking for a price action reversal with price reversing back lower.
One of the best things about this pattern is that you can use it on any time frame and in pretty much any market you like.
The head and shoulders is known to be one of the most reliable and widely traded chart patterns and in today’s lesson we go through exactly how you can find and trade it.
How to Identify the Head and Shoulders Pattern
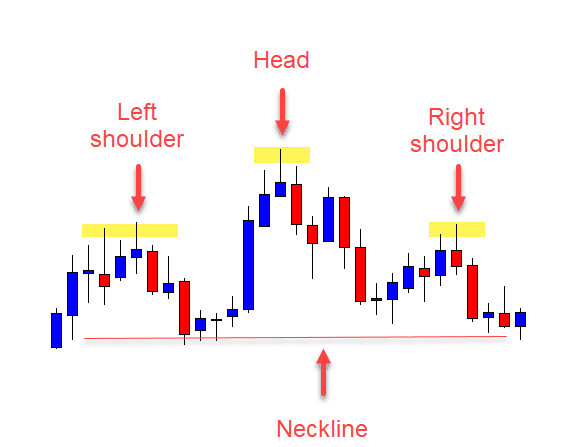
The head and shoulders pattern is formed with a left shoulder, a middle peak and then a right shoulder.
The left hand shoulder is created when price rises only to fall back lower. Price then rises higher and past the left shoulder to create the peak, only to fall back lower again. The right should is then formed when price rises and falls again at around the same level the left shoulder also rejected.
See the example below. The left and right shoulders reject around the same resistance level and in the middle price forms a peak.
There is also a neckline at the bottom of the pattern that as we will explain is very important for the pattern completion.

Head and Shoulders Pattern Rules
The head and shoulders pattern has some key rules you want to follow when looking for it and trade it.
These rules are;
- The pattern needs to form after price has been in a trend higher. This is a bearish reversal pattern.
- The peak in the middle needs to rise substantially past the left hand shoulder.
- The right shoulder needs to be rejecting the same resistance that the left hand shoulder is.
The head and shoulders pattern is a bearish reversal pattern. You are trading this pattern looking for price to make a move back lower.
With this in mind this pattern works best when price has been making a trend higher. After the trend higher and the head and shoulders forms, you can then start to look for reversal trades back lower.
Head and Shoulders Pattern Entry
There are a few different ways to enter the head and shoulders pattern, but in this lesson I am going to show you the two highest probability entry strategies.
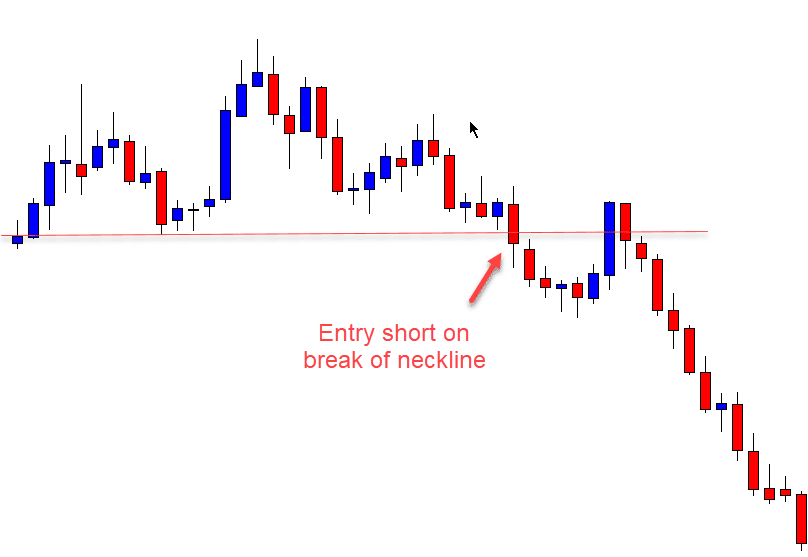
The first entry strategy is the most agressive. This strategy is higher risk, but it also ensure you will not miss any potential trades.
Checkout the example chart below. Price has formed the head and shoulders pattern and we have identified the neckline of the pattern.

To make an entry we are looking for price to confirm the pattern and break lower and below the neckline. Once this occurs we can enter short trades.
You can enter either manually or with a pending sell stop order.
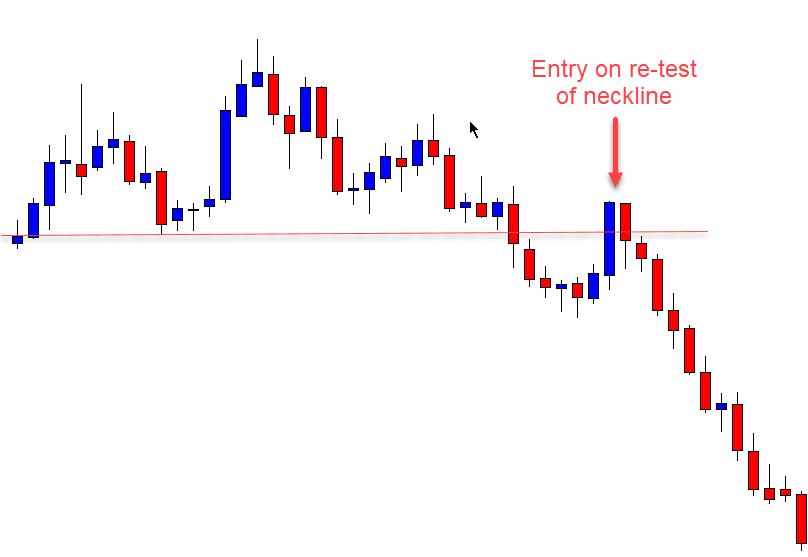
The second entry strategy is more conservative, but higher probability. With this strategy you will run the risk of missing out on potential trades.
You don’t have to use this entry strategy alone and you can use it as a second change entry strategy if you missed out on the first entry.
Checkout the example chart below. Once you have noticed that price has broken below the neckline, then you are looking for price to make a re-test.

When price makes a re-test of the old neckline support and new resistance you can enter short trades.
To further increase your trades odds you can also look for bearish rejection candlesticks at this level to confirm that price has rejected this resistance level.
Head and Shoulders Pattern Profit Target
There are two common profit target strategies with the head and shoulders pattern.
The first strategy is using the next major support level as your profit target. This is very straightforward. All you have to do is use the same time frame you are trading the head and shoulders to find the next major support and set your profit target there.
The other strategy involves looking at the distance between the middle peaks high and the neckline. Price will often move the same distance after breaking out that it has from these two points.
If you are putting your stop above the right shoulder, then you will also be able to often get a 2:1 risk reward trade.
Inverse Head and Shoulders Pattern
Oddly enough the inverse head and shoulders is exactly what it sounds like, the head and shoulders pattern, but inverse.
With this pattern you are now looking for a bullish reversal after price has been making a move lower.
You can find this pattern when price forms a swing low and left shoulder, a middle low and then the last swing low and right shoulder.
You can trade this pattern with the same profit targets and stops as the normal head and shoulders pattern, only in reverse.
Instead of selling short when price breaks lower through the neckline, you will be buying when price breaks higher through the neckline.
Lastly
The head and shoulders pattern is one of the most popular and widely used patterns in many different markets for a reason.
Whilst it can take a little time to get comfortable identifying, this pattern can be very reliable when traded correctly.
You can use this pattern on many different time frames and in pretty much any market you like.
The best thing you can do is get on your free demo charts and start practicing the best ways to enter and set your profit targets to see what suits you best.


Leave a Reply