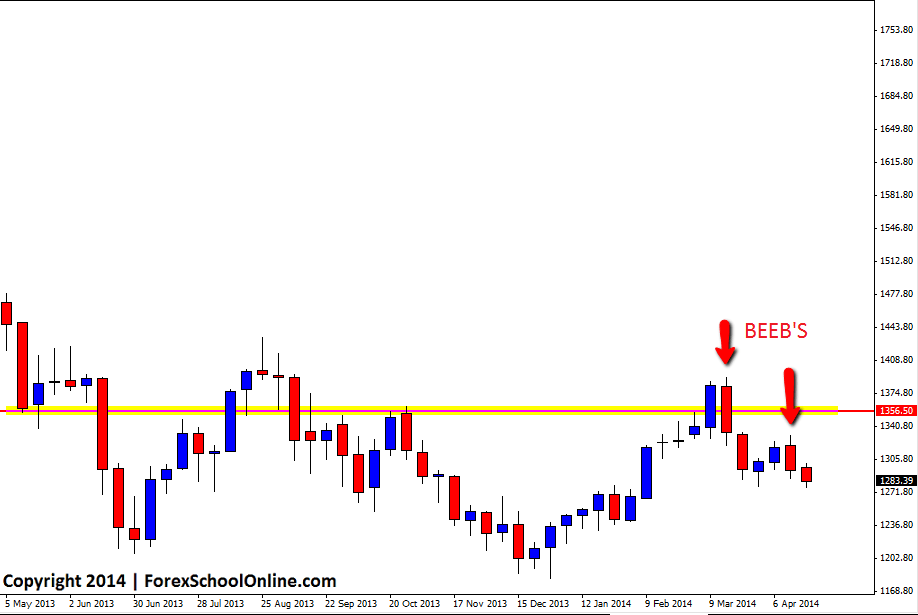
Gold has now moved lower after forming double bearish engulfing bars (BEEB’s) on the weekly price action chart. The first engulfing bar that formed was up at a swing high and rejecting a key resistance level and this engulfing bar was also a large and obvious setup that most traders who flicked to the chart would have spotted straight away. It’s always a pretty good sign when you flick to a chart and a setup jumps straight out of the chart at you. When traders have to go searching and really working hard to find a setup, they probably need to question if they should be playing that trade because if the setup does not jump out at them straight away, then maybe they are forcing something that is just not there.
After price broke lower and confirmed this first obvious BEEB it moved lower and into the first near term support. From the near term support, price has retraced higher and moved back into the engulfing bars low. Price has now formed another bearish engulfing bar on the weekly chart in-line with this first setup. This BEEB is not as solid as the first setup because it has not formed up at a swing high and it is also sitting on that support level I just discussed, however it is inline with the first BEEB and if price can break, price may make another run lower.
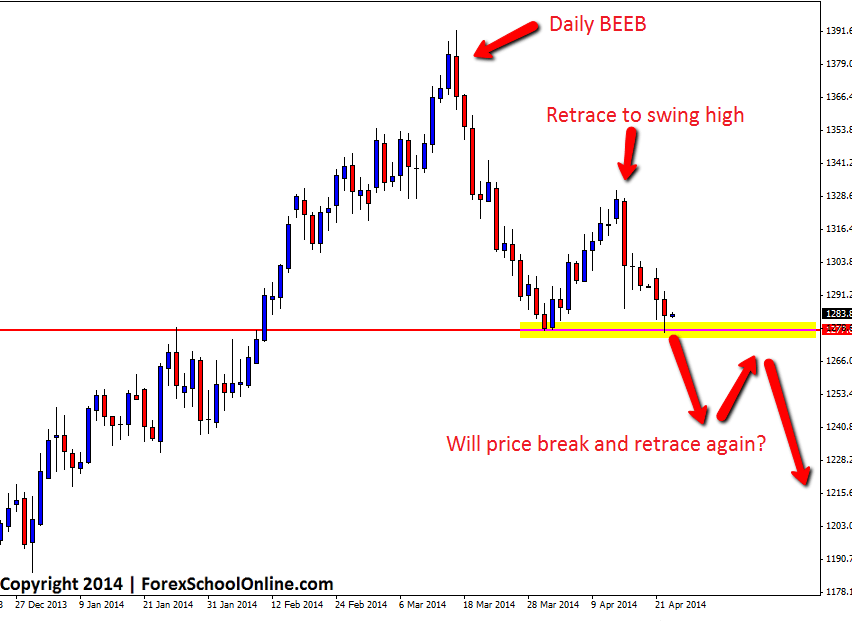
The main reason I have made today’s post about the back to back engulfing bars is because I want to highlight the pattern on the daily chart in this market that these engulfing bars set off that all price action traders need to be aware off because it can lead to high probability trades. At the very high of the daily chart price fired off a bearish engulfing bar. This would be a risky trade to take because it was against what was at the time a strong up-trend, however price then moved strongly lower. After selling off lower, price found support and retraced back higher back into resistance. When price retraced higher this would be a solid point for traders to start hunting for short trades. Making short trades at this level would be making a trade from swing high, a strong daily resistance level and also in-line with the recent down momentum. Traders could then use this same daily level to trade on the intraday charts such as the 4hr or 8hr charts.
This pattern repeats over and over again all over the Forex and Futures markets. I have marked on the daily chart below what could possibly happen in the coming days or weeks with price possibly breaking lower and then repeating the pattern by retracing higher and back into resistance, giving traders a chance to hunt for short trades. Whilst this may or may not happen, what traders need to take away is the lesson of the pattern and where to take their reversal trades. Traders need to be taking their trades from value areas. The key for traders is to watch closely when the market retraces into value and then pounce and make high probability trades when the opportunity comes.
Gold Weekly Chart

Gold Daily Chart


So how would you trade this? Would you go long for a quick scalp at the next area of support and then reverse the trade at resistance marked at your red line and hold it short for a longer-termed trade?