GOLD DAILY CHART
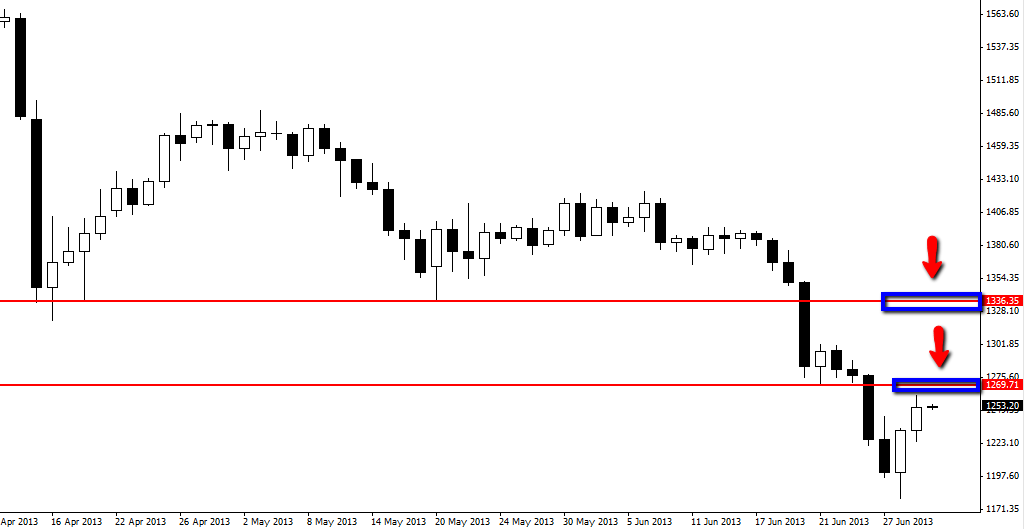
Price on the the daily chart of Gold has produced a bullish rejection candle which has pushed price higher. This push higher is the first substantial move higher for price in the last few months as the bears have been in total control and have sent price lower at every chance.
Price is in a clear down-trend and until price shows signs of changing this trend the best play is to keep trading with this obvious trend. Now price is moving higher it could provide traders with some very high probability trades to get into trades with the strong trend and at logical key resistance areas. If price moves higher there are two key resistance areas price action traders could target to get short should they get price action to confirm a trade. Traders could look to both intra-day charts such as 4hr and 8hr charts and also the daily and 2 day charts to get short.
GOLD DAILY CHART | 2 JULY 2013

AUDUSD TWO DAY CHART
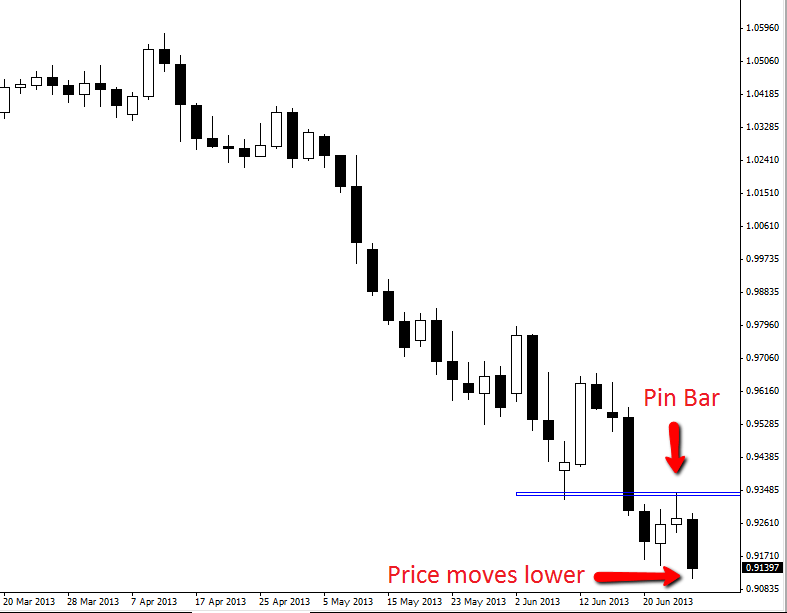
On Friday I posted about the two day Pin Bar that had formed on the AUDUSD. To read the original post see HERE. Price has now moved into the first support level that we thought price could target if it could move lower. This move lower has given traders the chance to take profit or at least protect their capital by shortening their stops.
AUDUSD TWO DAY CHART | 2 JULY 2013


Leave a Reply