Gold has formed a base on the daily chart and has now made the 1,2,3 trend change pattern with higher highs and higher lows signalling price is in an up-trend on the daily chart. You will notice on the chart below, before changing to an up-trend at the very low, before making a move higher price had two cracks at the low and formed a base on the daily chart which is very common when trends change. It is very rare for price to just change straight away without without some form of consolidation or at least at the minimum two attempts at continuing in the same direction.
As we have covered extensively in this website for the traders that follow, the best edge that traders can have is trading with the trend on their side. Trading with the trend puts a massive advantage on the traders side before even entering the trade. The traders can’t just enter the trend any where though and they have to look to get into the trend at key areas.
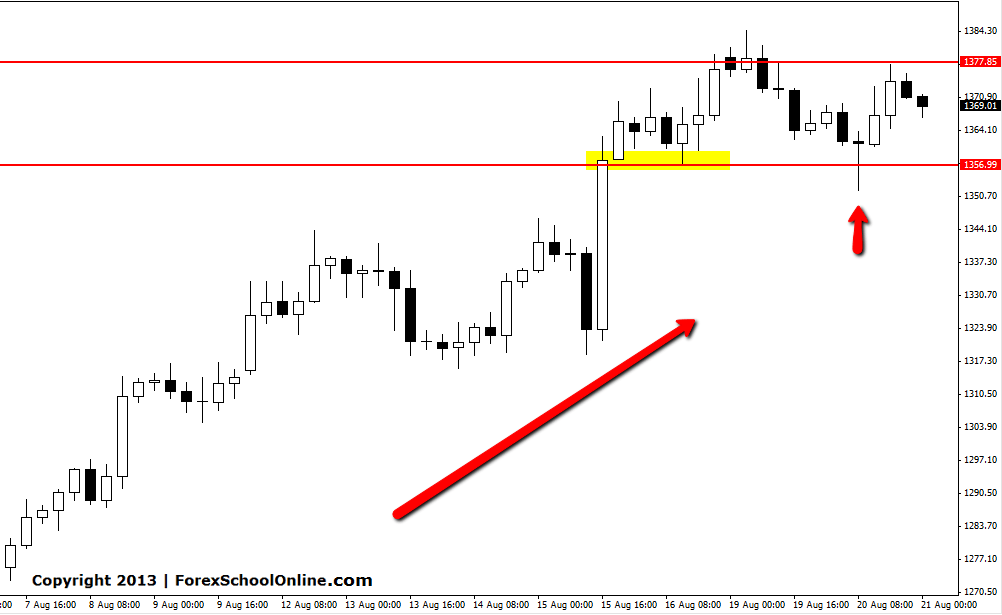
Price on this chart yesterday pulled back into a solid support level that has acted as a key support level on the daily chart previously. At this support level price fired off a bullish Pin Bar reversal that was in-line with the recent up-trend on the 4hr price action chart. Once price broke this pin bar high it moved higher into the near term highs to test the recent resistance and as I write this blog post is is testing resistance.
GOLD 4HR CHART


Leave a Reply