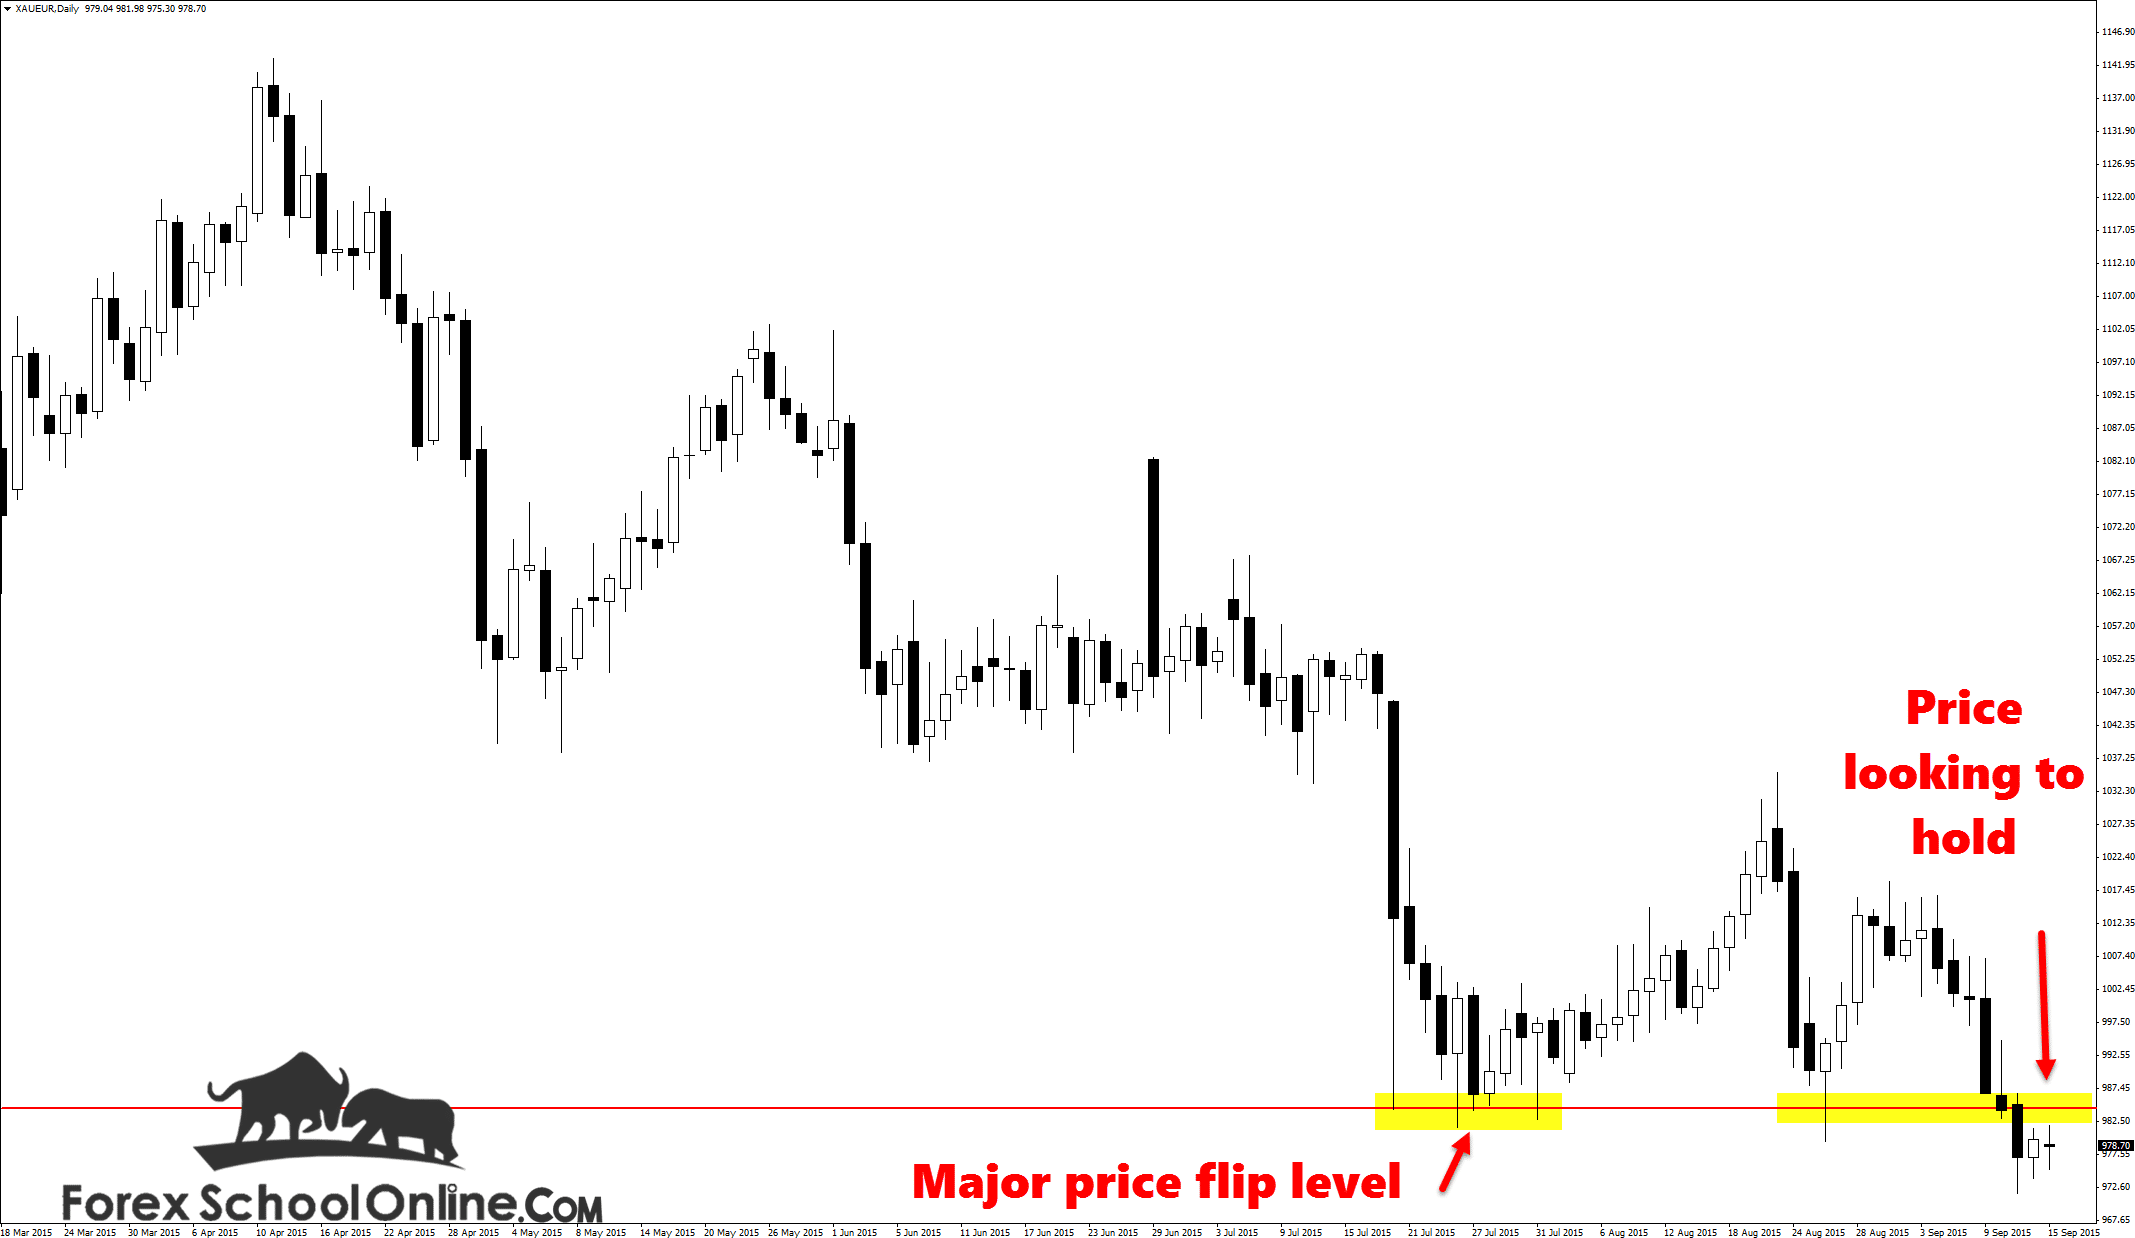
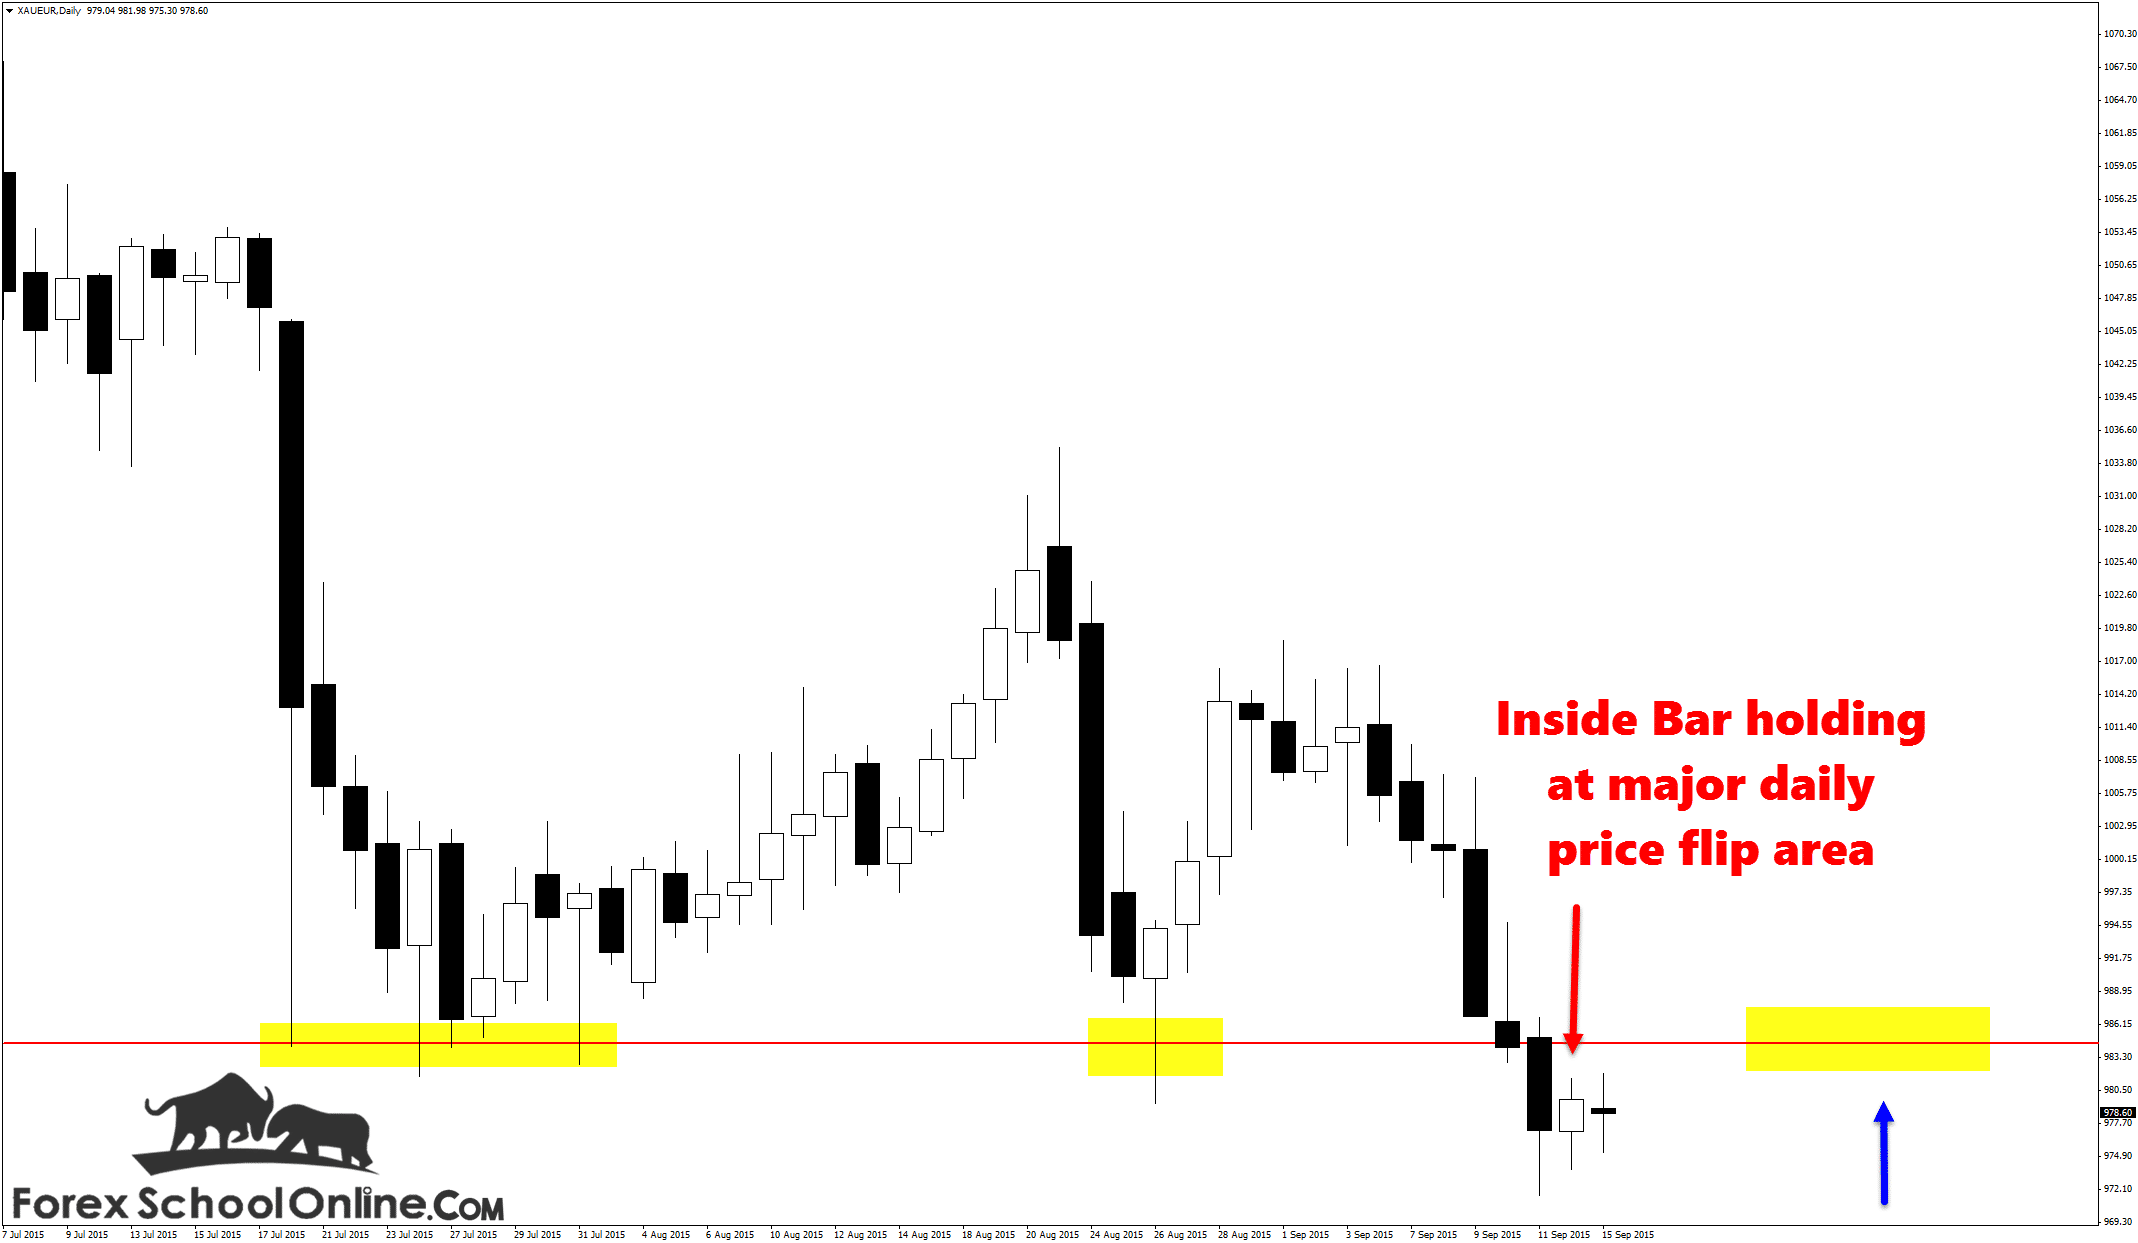
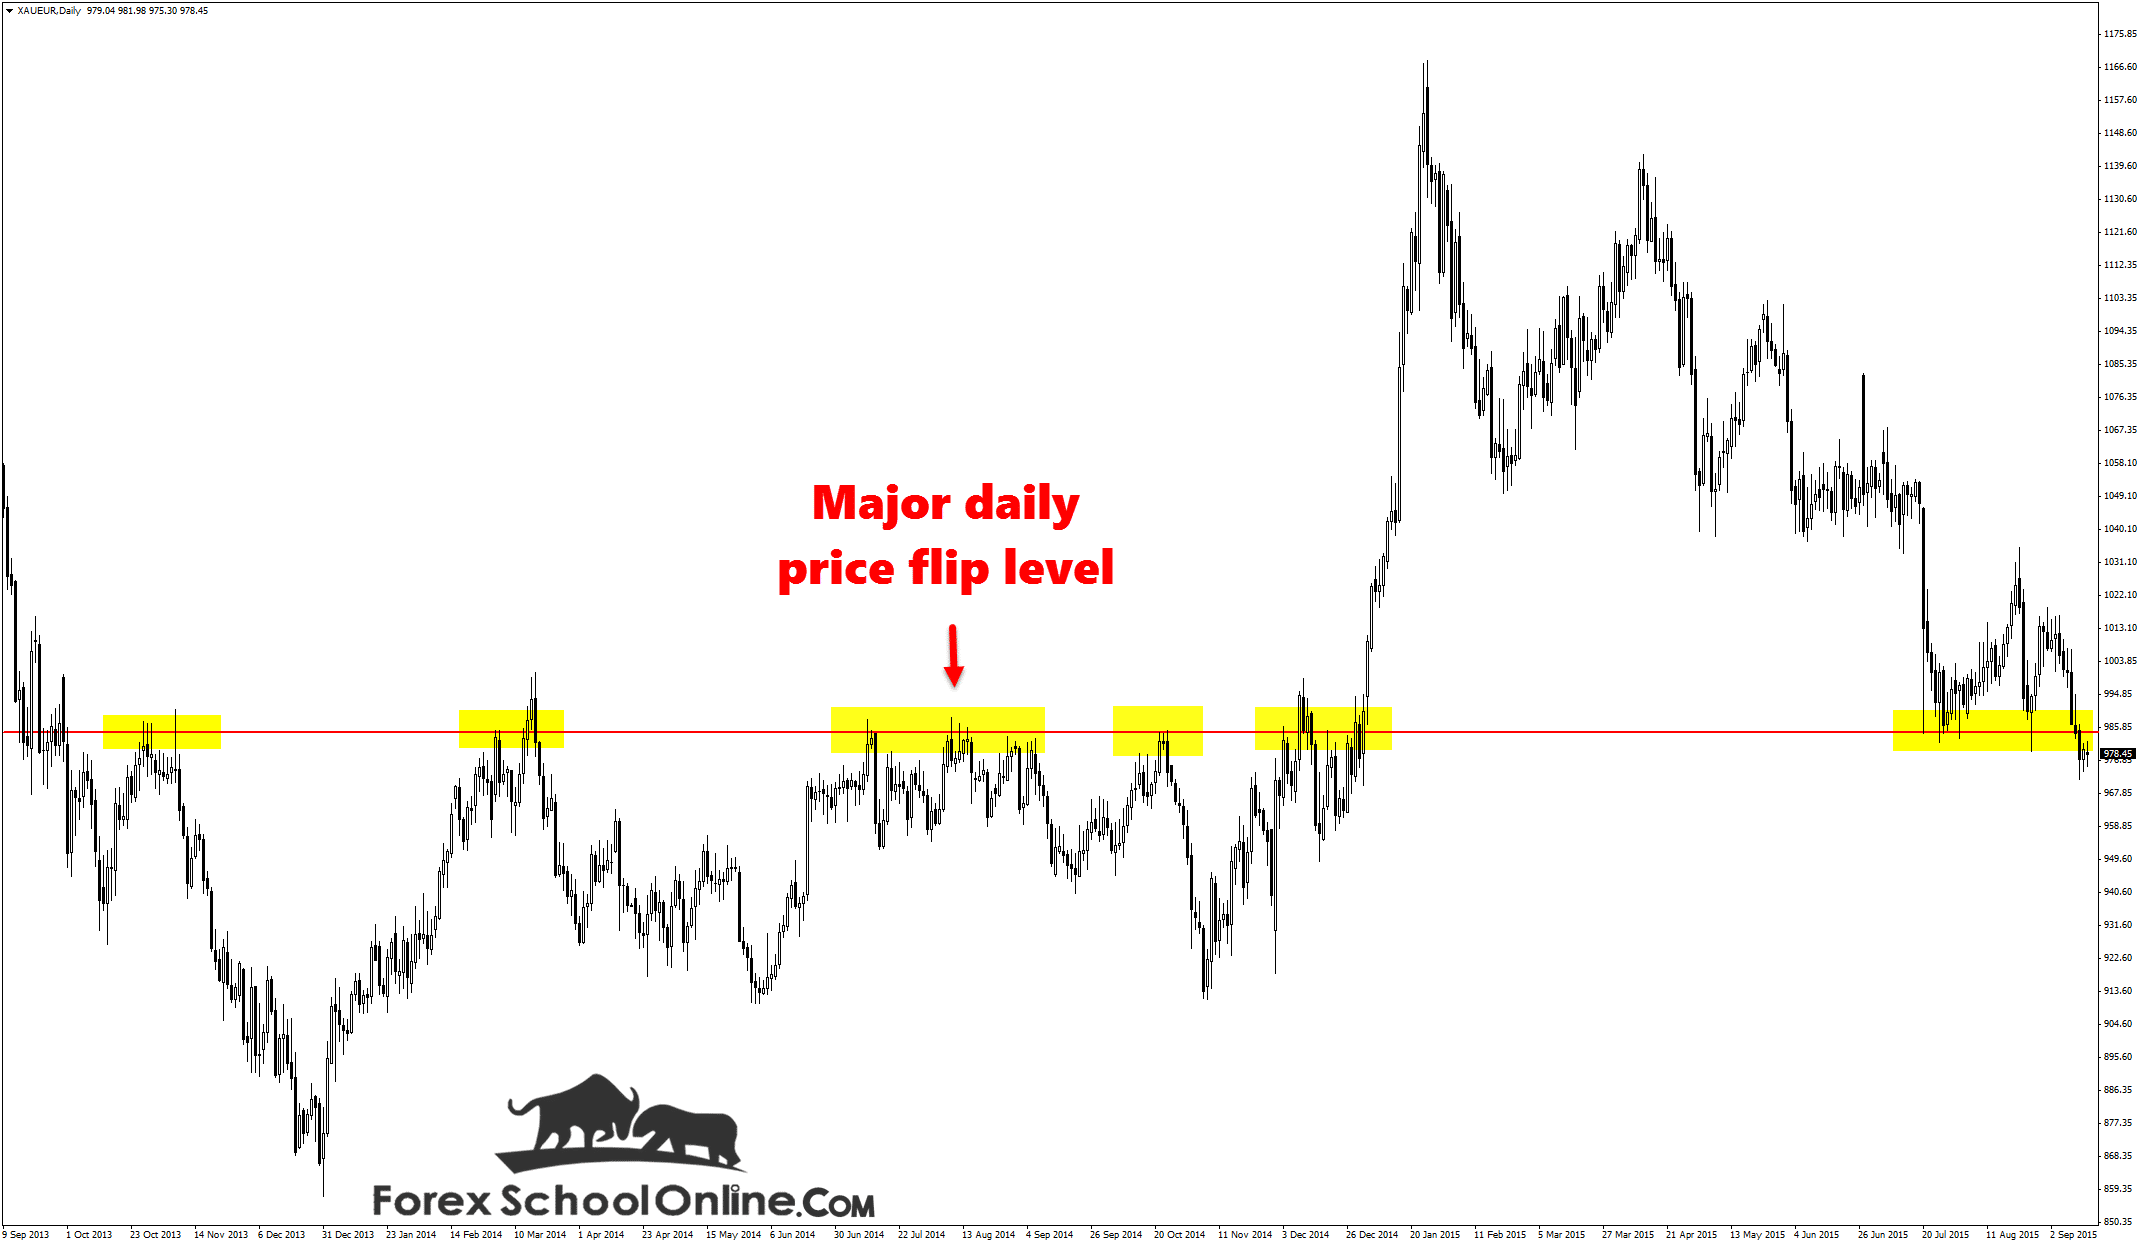
Price on the daily price action chart of the Gold v Euro has fired off an Inside Bar = IB just underneath a major price flip area. This price flip area has been a major level on this chart, as the three charts below all show. Price has respected this level over both the longer and shorter term, as both a support and resistance level, flipping back and fourth.
Price had been attempting to try and stay above this major level with a strong rejection off the support coming on the 26th of August in the form of a pin bar. Price moved higher, but this was short lived. After this rally higher, price rolled over to where we now find it below the support with the inside bar.
What happens now is going to be crucial for where price goes next and that is why this inside bar is so crucial for the price action of this market. As I discuss in my inside bar trading lesson, How to Trade Price Action With the Inside Bar, the inside bar is generally a continuation signal.
Now that price has broken a major level, and then paused and formed an inside bar or a continuation signal, if price is to break lower from the lows of the inside bar, then it could trigger the next move lower. If we look back to the left of this chart, we can see that there is a ton of traffic and support levels and that makes this chart a super tricky chart.
Charts like this that have a lot of traffic and previous support or resistance areas are super difficult to manage because they don’t offer a clear path to manage. There is no easy way for price to move clearly. If price can break lower, the next support comes in around the 967.60 and then 958.25.
If price moves higher, the price flip resistance is going to be the major level to keep an eye on. This is the crucial level and if price does move back higher and close above it, then once again, price flips and goes from old resistance/to new support.
Daily Chart

Daily Chart
Daily Chart – Inside bar


Leave a Reply