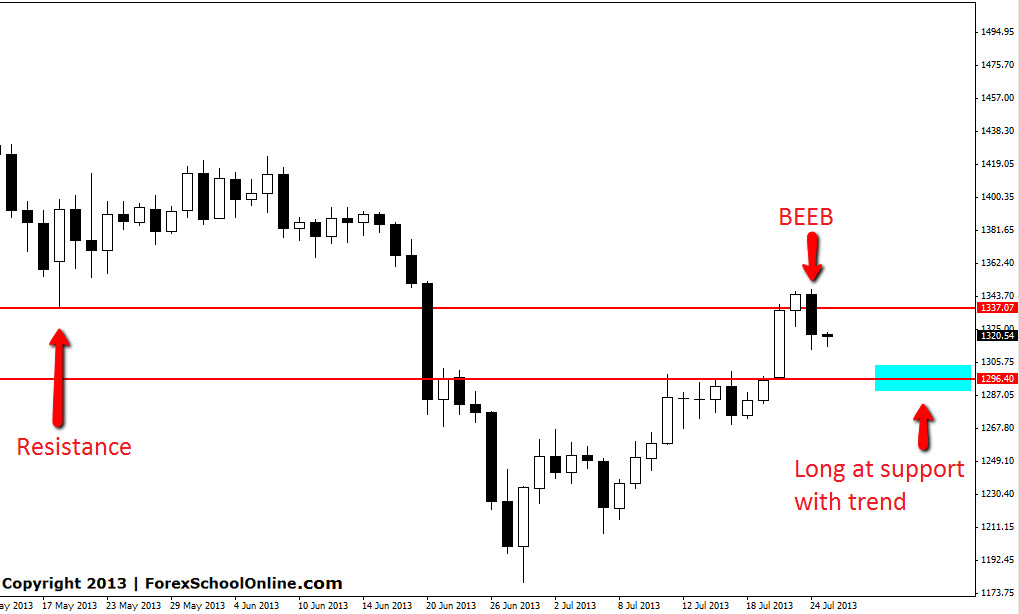
Gold has fired off a bearish engulfing bar on the daily price action chart at the resistance chart for this market. This is not the largest or most commanding engulfing bar that has ever been, but it is a valid engulfing bar all the same that has a higher high and lower low than the previous candle.
The very recent short term trend in this market has been higher. We can see on the chart below price has made higher highs and higher lows and has now broken the short term key resistance that has proven to be a crucial level in the short term. If price can break the bearish engulfing bar low price could move lower and back into this critical new support level. This is where this new up-trend could possibly continue and also where trend trading price action traders could look to get long if any bullish price action signals present.
Traders could target trades on all higher timeframes above the 4hr chart including the 8hr,12hr and daily charts. If you have any questions you can contact me HERE.
GOLD DAILY CHART | 25 JULY 2013


Leave a Reply