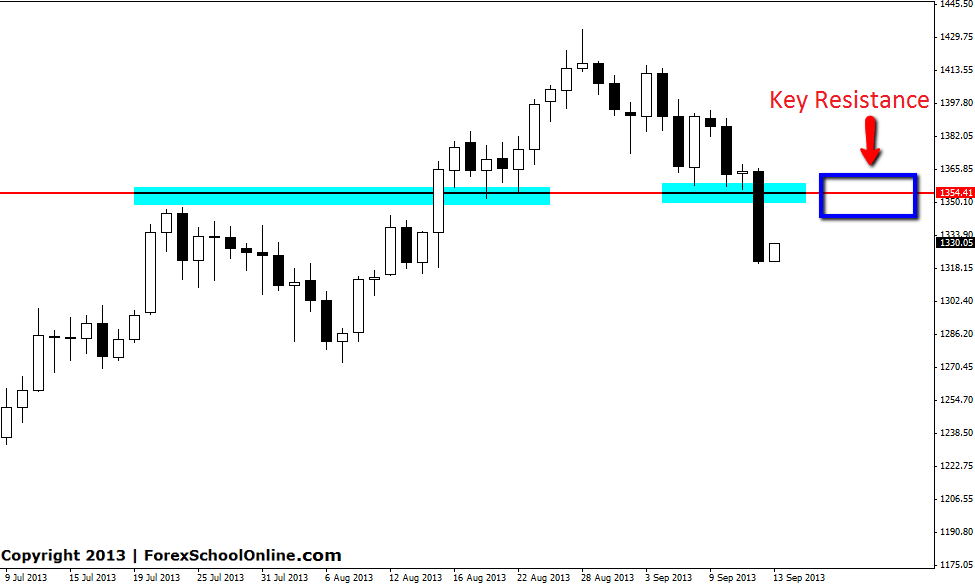
Gold has smashed through a key support level on the daily chart and closed through, with the bears in the last session clearly in control. This support that price has just broken through, has been a key level previously and has acted as both a key support and resistance in the past. Traders can look to this level to act as a price flip zone and go from acting as a old key support to new key resistance.
If price moves higher and into this new key resistance level, traders could start targeting short trades. For any possible trades to be confirmed there would have to be A+ bearish price action present at this level. Traders could hunt for trades on their daily and intraday charts such as 4hr & 8hr charts.
GOLD DAILY CHART


Leave a Reply