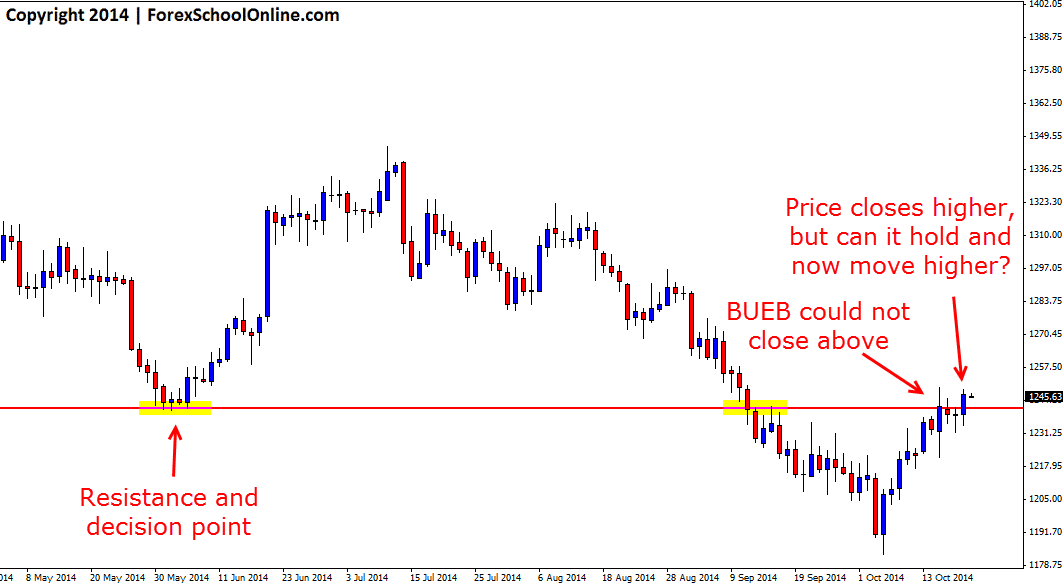
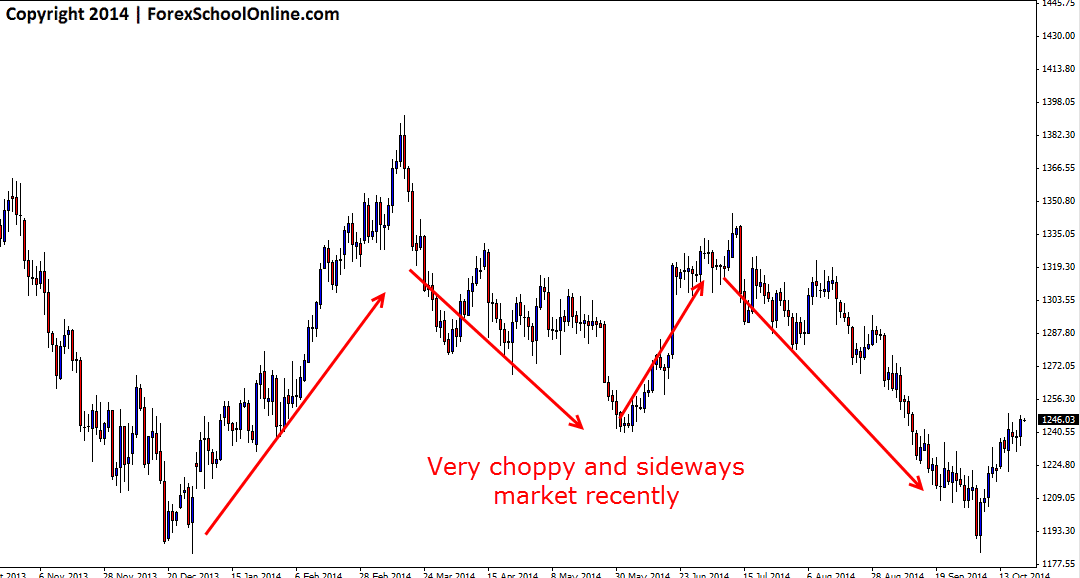
Price on the daily price action chart of Gold (XAUvUSD) has just broken above an important decision point that could be crucial to where price moves over the near term. Price in the recent few months on the Gold daily chart has been a mess with no clear direction or trend and key levels have become extra important. The times of a few years ago where price was in a raging uptrend and all traders had to do was wait for a simple rotation back lower into a value area are now clearly gone, with the chart below showing that price is at the moment uncertain of where it wants to go in the medium term.
In the short term however, price has now broken higher and closed above the key resistance and for as long as this old resistance and now new support level holds we can look for the level to act as barrier for price to move higher. As I discuss in the trading lesson What Traders Can Learn From Price Action and Candlesticks where price can and cannot close on price action charts can tell traders a lot when they learn to read it.
This new support becomes crucial because if price simply cuts straight back though lower, we could move back into sideways trading, but a move higher could present with a potentially more free flowing market. If price can break higher, there is short term space overhead to move into which means price could quickly gain momentum and any move higher could be a quick one. This is definitely a market to watch over the coming days.
Gold Daily Price Action Chart

Gold Daily Price Action Chart – Zoomed Out


yes your article and daily price action setup is to good. well done keep it up