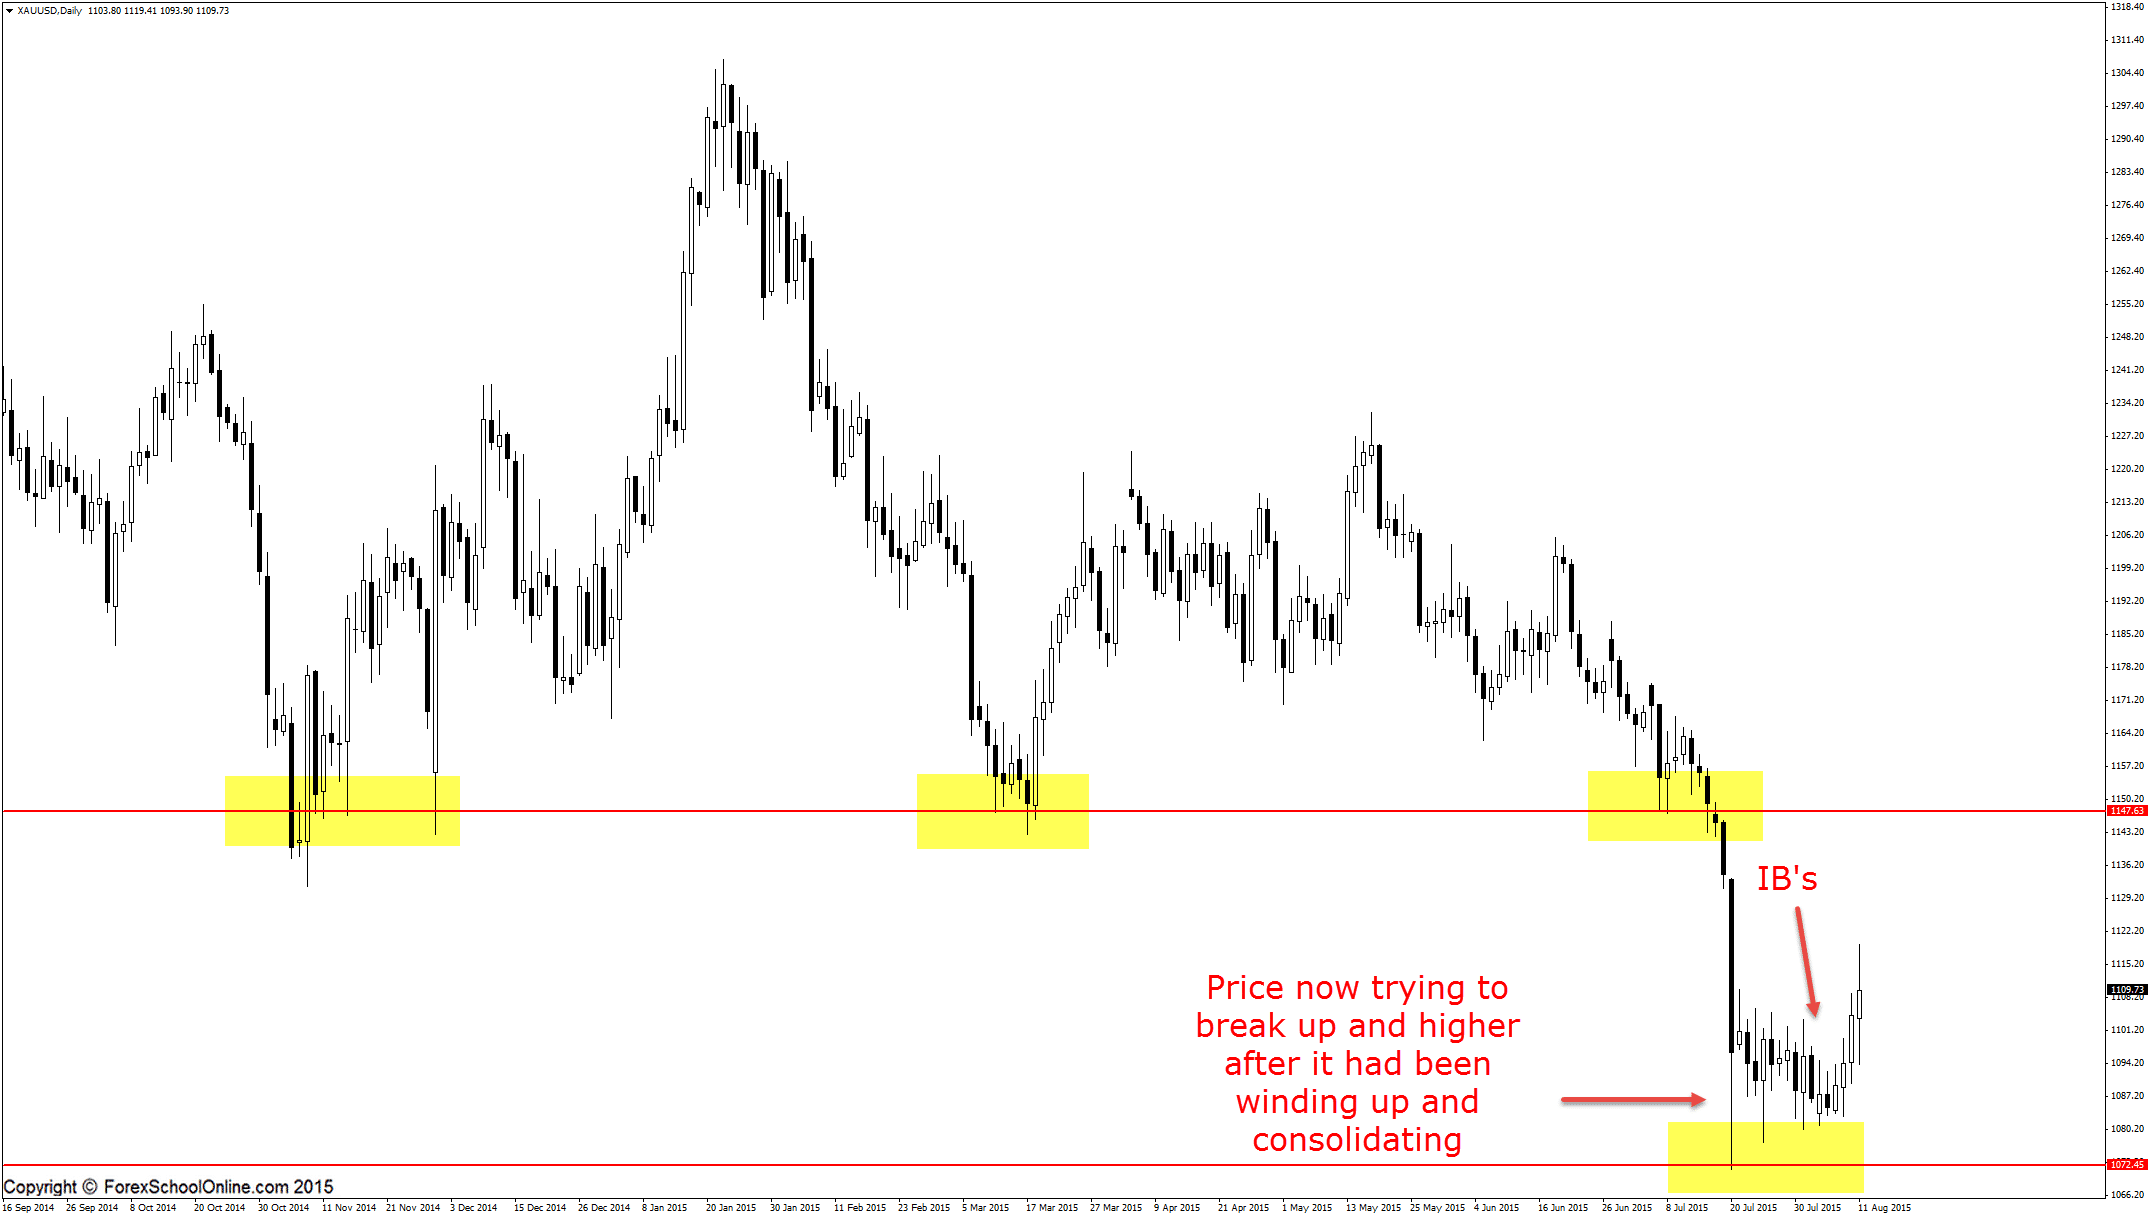
Gold is now attempting to breakout higher of a longer term daily support area, after it had been winding up and consolidating for the last three weeks down at the low. Price is now trying to bust out of this area and as the daily chart shows below; just before we had this attempted break we had a real windup with a series of inside bars.
The longer a windup goes on and the tighter price winds up, normally the stronger a breakout will be when it happens. You will see this repeating on all pairs and time frames where price winds up tighter and tighter and then BANG a huge breakout occurs with a massive breakout.
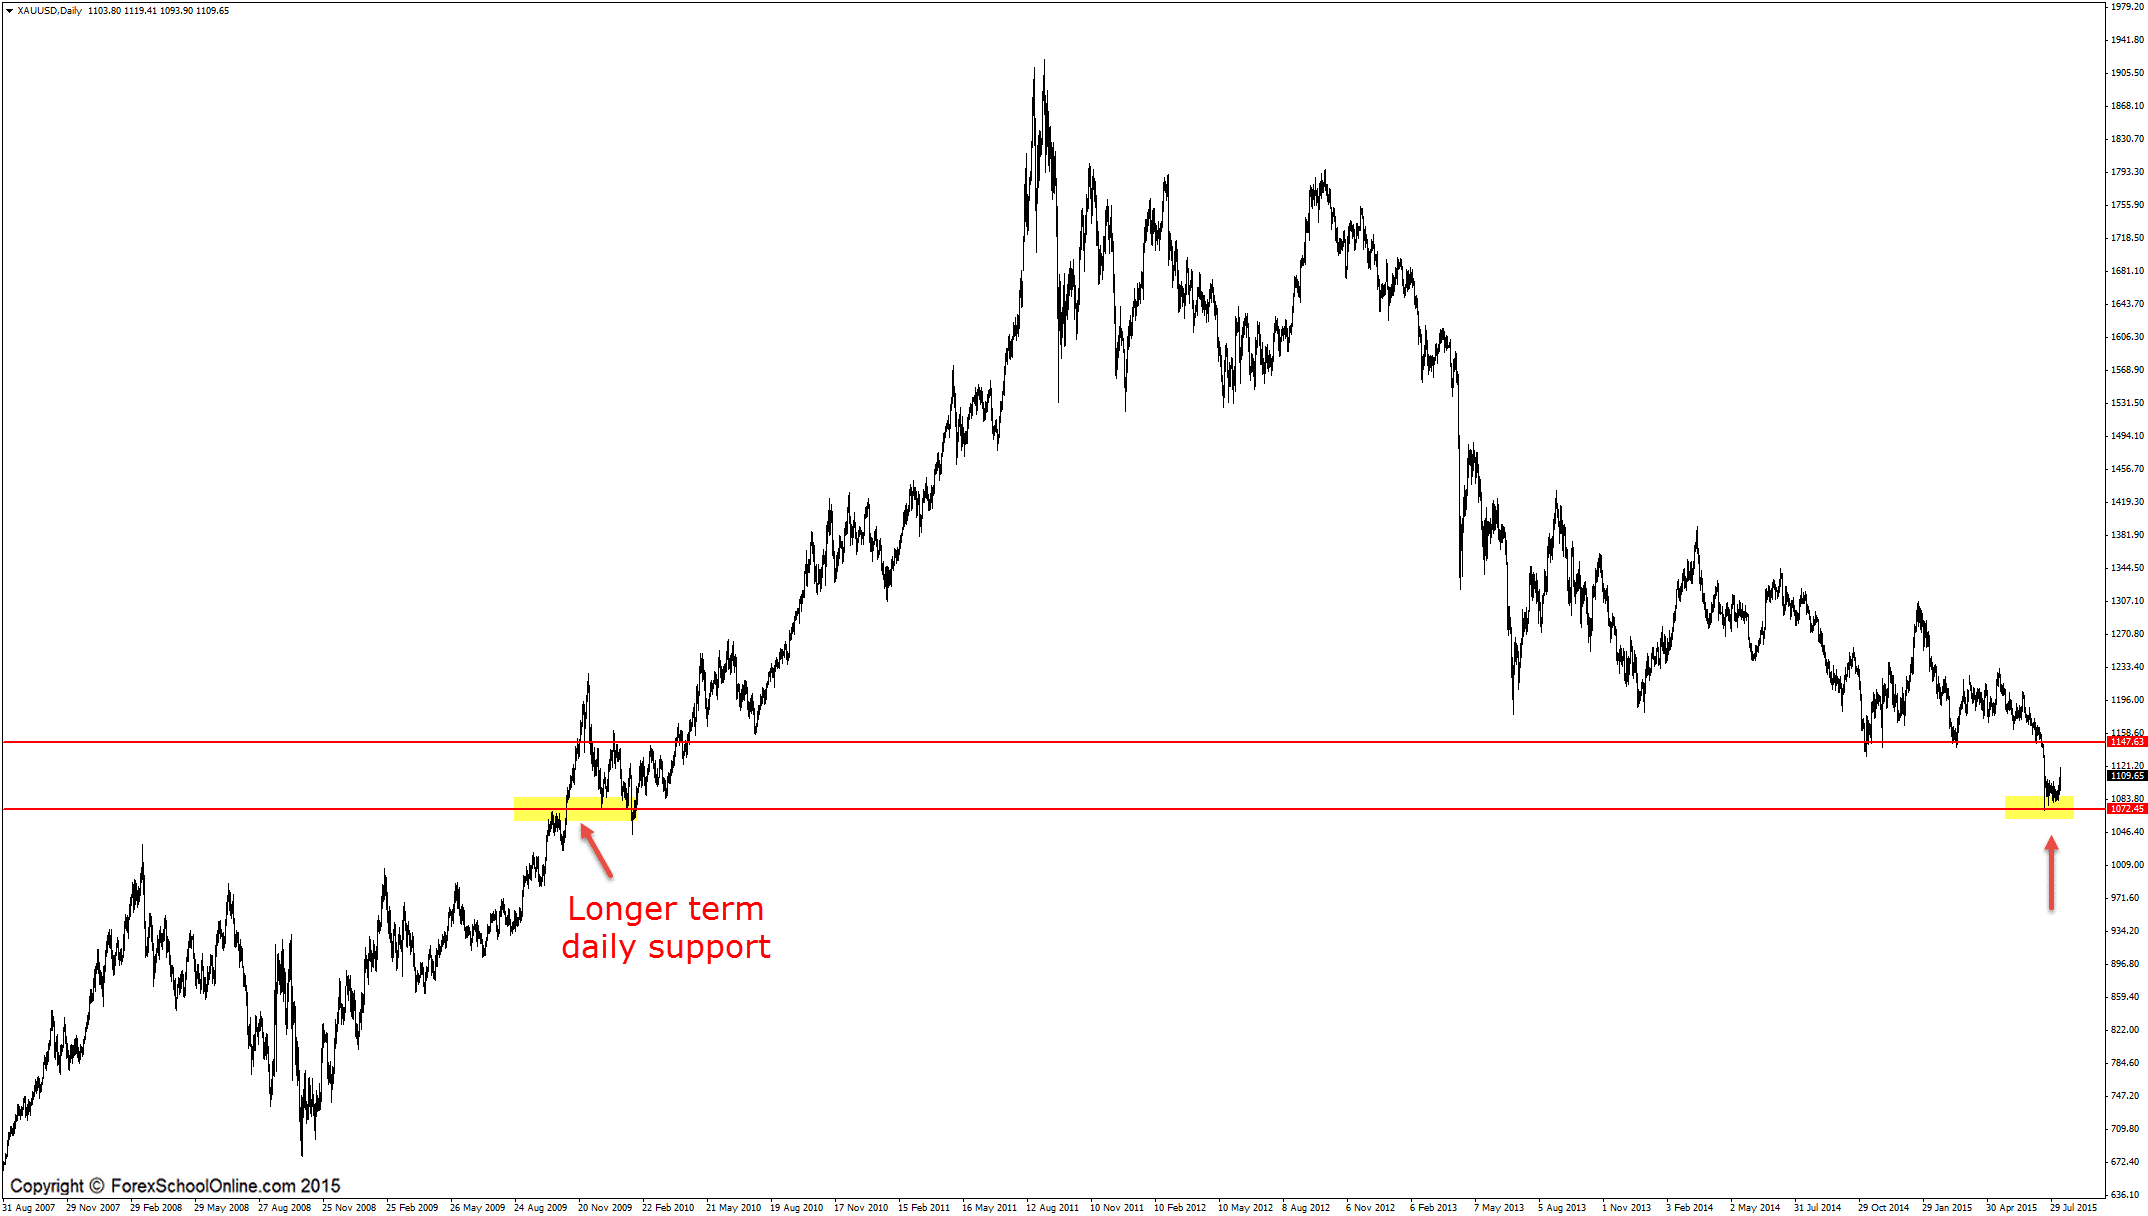
With this market if price can breakout higher we have a really crucial resistance sitting overhead that could be a really high probability level to hunt potential short trades at. This resistance level has acted as a major flip level in this market as the zoomed out chart shows below, being a proven support and resistance level.
If price can rotate higher from this breakout position and into the major daily level, you could watch the price action behavior to see if the level does hold as a resistance and for potential short trades. For any potential short trades to be confirmed at this daily level you would need to see A+ high probability bearish trigger signals such as the ones taught in the Forex School Online Lifetime Membership Course. You could hunt for trades at this level on both the daily and intraday time frames, such as the 8hr/4hr/1hr or even lower if you are comfortable on those smaller time frames.
If price falls back lower from here, it first has to get through the long-term daily support level and if that gives way there is then a lot of space for price to free fall into.
Daily Chart

Daily Chart – Zoomed Out

Related Forex Trading Education
– The Ultimate Guide to Marking Support & Resistance on Price Action Charts


Leave a Reply