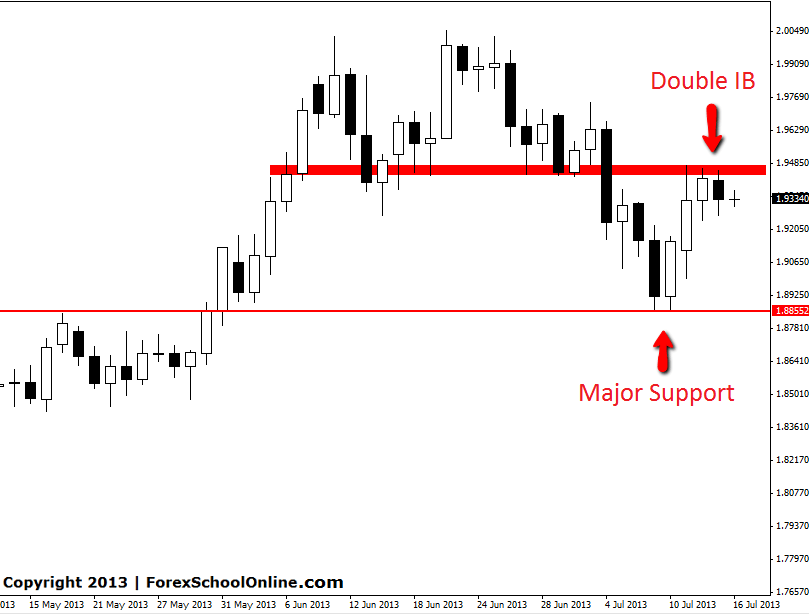
The GBPNZD has fired off double inside bars (IB) on the daily chart just underneath resistance showing that the resistance on the daily chart is holding at this stage and could hold for the next leg lower if price can get the next push. Inside bars are indecision candles and when we see two of them back to back it is showing price action that is getting ready to make a break out. The longer price winds up making inside bars the stronger and more aggressive the breakout normally is.
This pair is in no clear trend at the moment and the best play is to look for key price action at key levels. If price can move lower there is a minor support around 1.9170 with the major support sitting at around the recent low at 1.8850. Because there is no clear trend traders could look to trade both long and short and if price does move into the major support traders could look to also get long from any solid price action at this key level.
GBPNZD DAILY CHART | 16TH JULY 2013


Leave a Reply