While the Pound side of the market presents relatively fewer fundamentals, the US dollar seems rich on that front. This has presented some caution in the GBPUSD market as investors anticipate the release of economic data such as the Manufacturing Index and PMIs that may move the market.
Key Price Levels:
Resistance Levels: 1.2950, 1.3050, and 1.3150
Support Levels: 1.2900, 1.2800, and 1.2700m

GBPUSD Price Movement Faces Minor Impedance
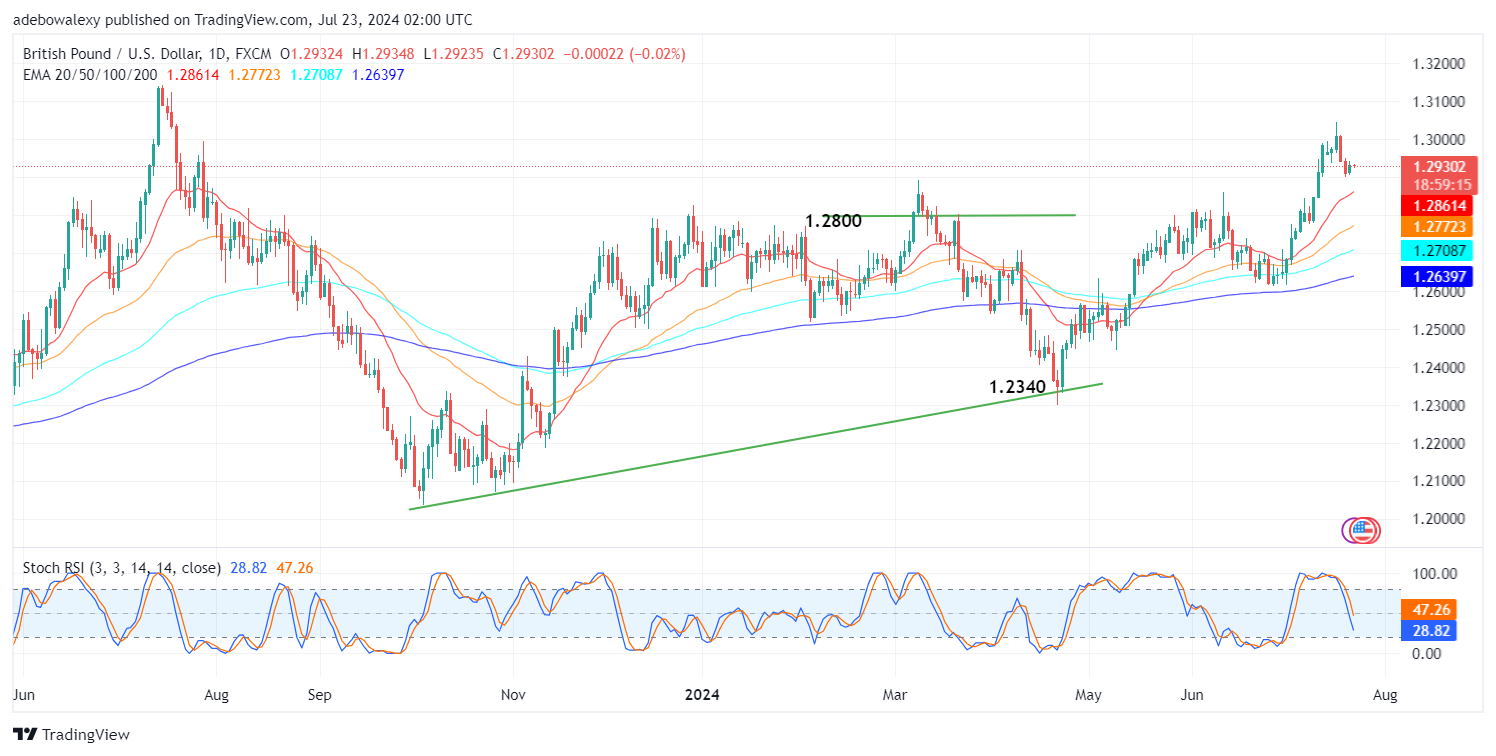
As earlier stated, it could be seen that price action in the GBPUSD market is experiencing low participation. Nevertheless, downward forces could be seen staying afloat in the ongoing session. The last price candle on the daily chart shows very little movement but suggests that the heading is of noticeable effect.
Yet, trading continues above the Exponential Moving Average (EMA) lines. Also, the session continues above all the EMA lines, which implies that upside forces still have a fighting chance. At the same time, the Stochastic Relative Strength Index (SRSI) lines have fallen considerably towards the oversold region and remain undeflected despite the more recent movement in the market. Consequently, traders may want to rely more on clues from EMA curves and fundamentals.

GBPUSD Sees Minute Upside Corrections Above the 50-Day EMA
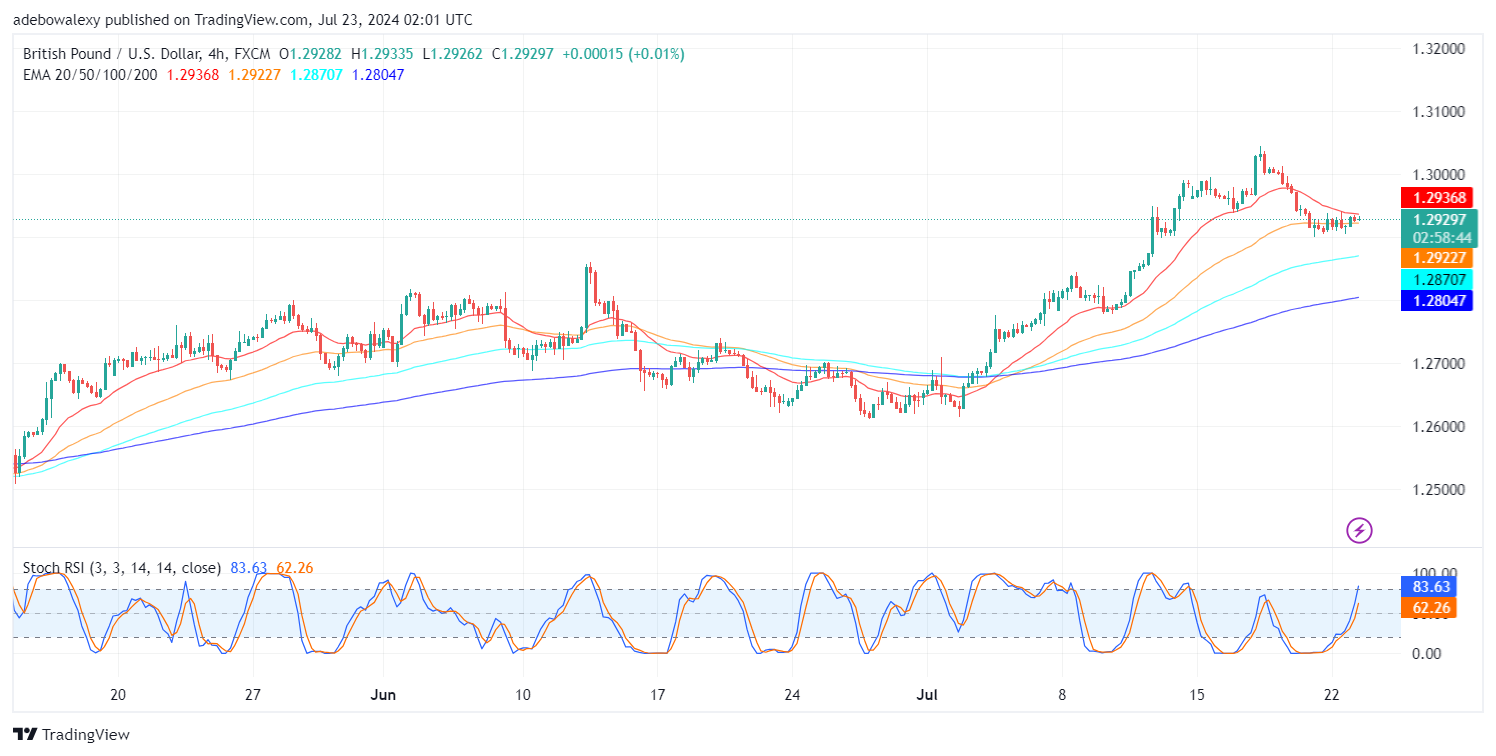
Price action in the GBPUSD 4-hour market can now be seen trapped between the 20- and 50-day EMA lines. However, buyers seem to be in the lead in the ongoing session. This is made evident by the color of the corresponding price candle.
Meanwhile, the Stochastic Relative Strength Index (SRSI) lines can be seen rising upward still despite the ongoing struggle between market forces as suggested by price movement. This hints that market participants may witness the market extending its upside correction towards 1.3000. However, traders will need to be abreast of relevant ensuing fundamental developments for more guidance.
Do you want to take your trading to the next level? Join the best platform for that here.


Leave a Reply