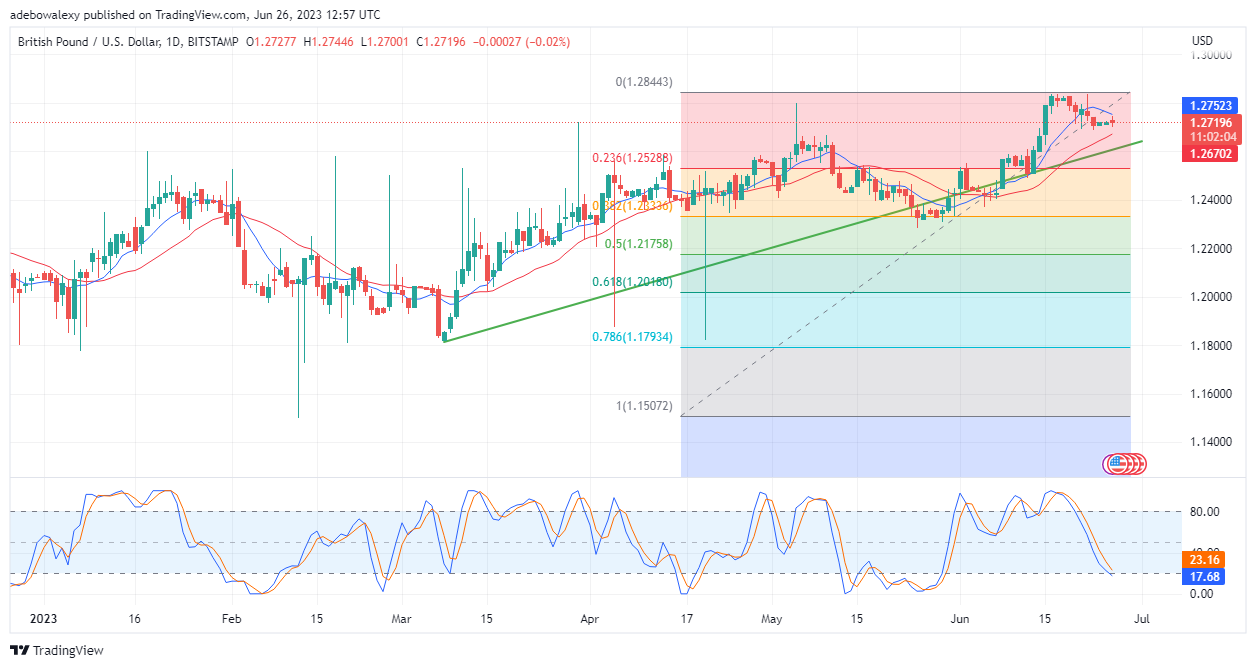
The GBPUSD pair has tested the terminal levels of the bearish region. Subsequently, price action has respected this level and has regressed towards lower levels. Nevertheless, the downward retracement has been interrupted occasionally by buyers, and this has presented traders with a dicey market.
Major Price Levels:
Resistance Levels: 1.2720, 1.2780, and 1.2830
Support Levels: 1.2700, 1.2650, and 1.2600

GBPUSD May Fall to the 1.2670 Mark
During the previous week, the GBPUSD developed bearish characteristics due to unfavorable fundamentals on the pound front. There have been attempts to resist the downward retracement in this market, but they appear too weak.
This is mostly due to the lack of market-stimulating fundamentals yet. Moving on, the new trading session seems to show bearish intentions in this market. The last price candlestick here is a red one, which stands for the price decline.
Also, price activity for about five sessions has been occurring below the 9-day Moving Average curve. Simultaneously, the RSI lines continue to trend downward into the oversold zone of the Relative Strength Index (RSI) indicator. Consequently, indications point out that prices may extend a downward correction.

GBPUSD Seems Set to Record Steeper Price Decline
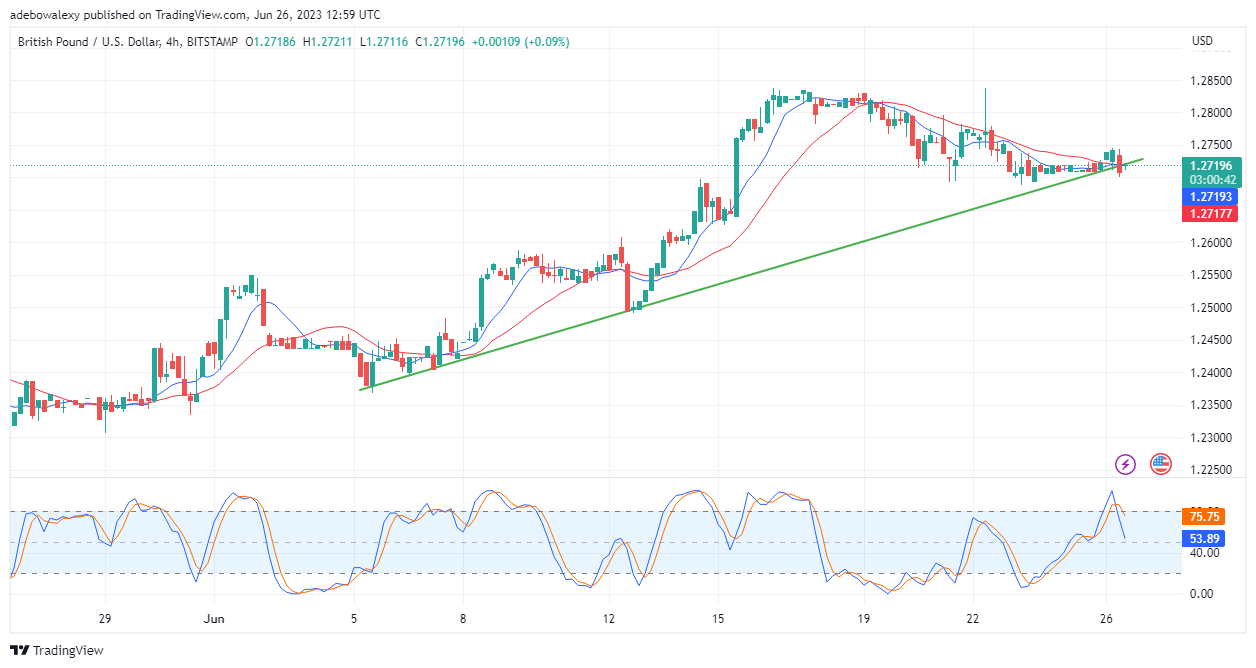
On the GBPUSD 4-hour market, price action seems to have broken down the upside-sloping trendline. At this point, price action is almost falling below the crossed 9- and 22-day lines. By implication, this suggests that the downward price correction may grow stronger from now on.
Furthermore, the lines of the Stochastic RSI indicator can be seen trending sharply downward following a bearish crossover. The behavior of the line of this indicator suggests that the above-stated opinions have now fallen below the 55 level, while the lagging one remains at level 75.
Consequently, traders can expect a retracement towards the 1.2700 mark.
Do you want to take your trading to the next level? Join the best platform for that here.


Leave a Reply