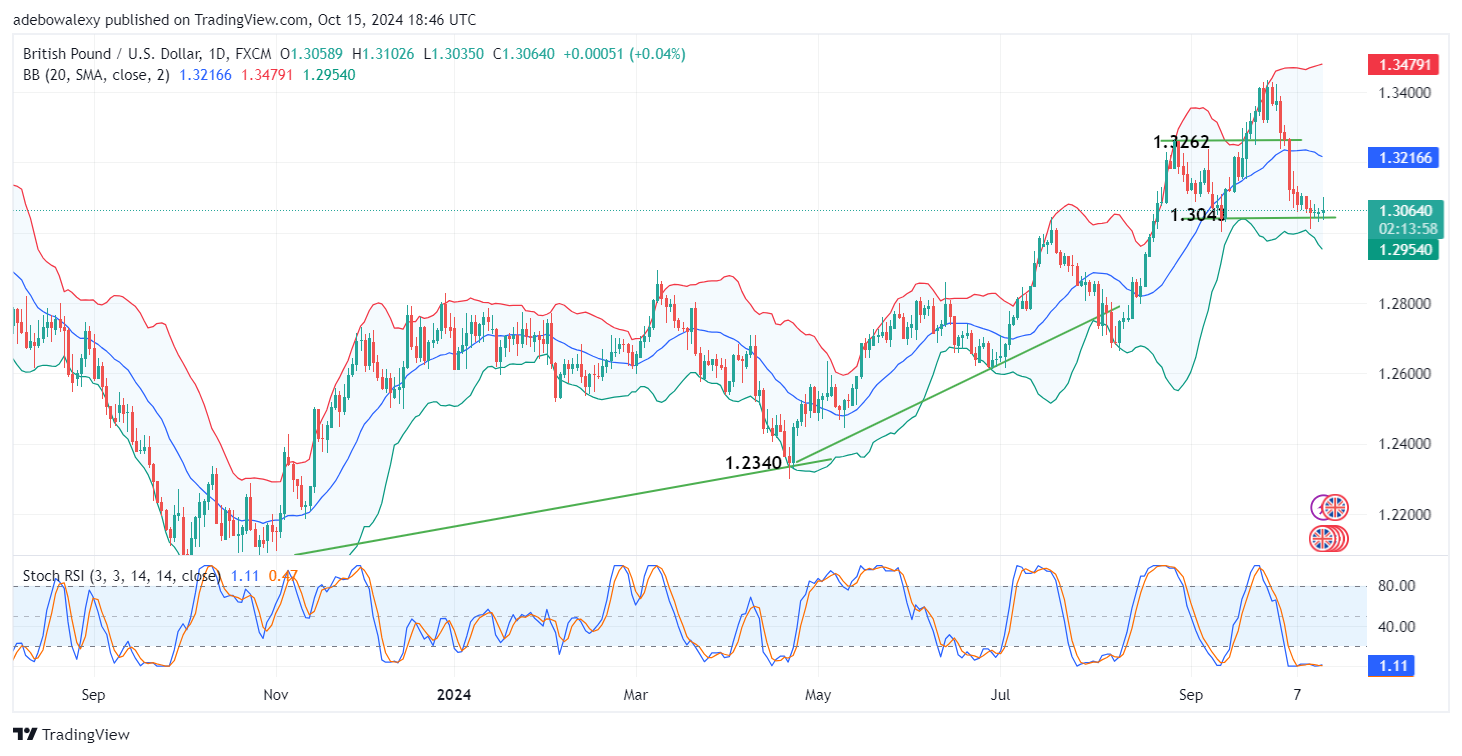
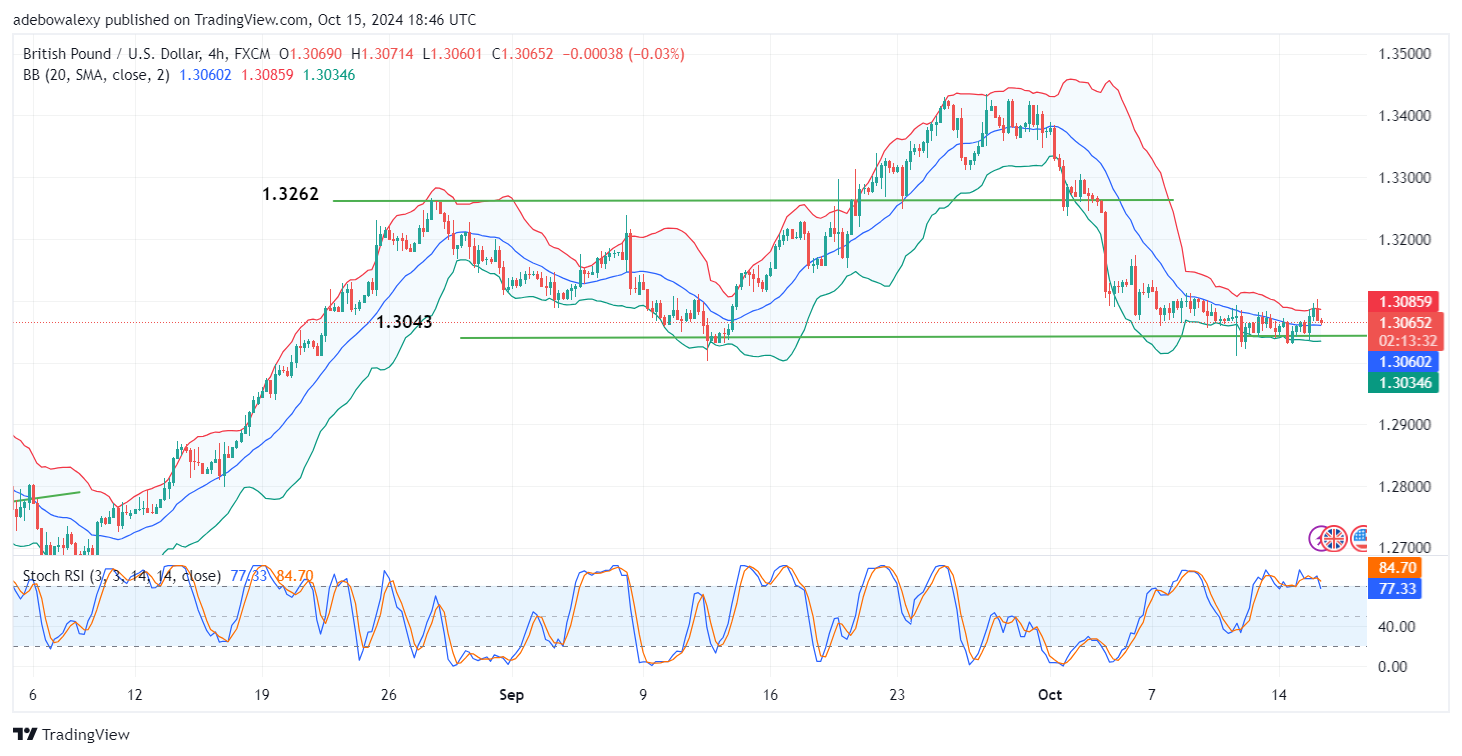
The GBPUSD market is struggling after testing the support level at the 1.3043 threshold. The market appears to be under strong bearish pressure, likely due to an improved DXY and the minutes of the FOMC meeting. The FOMC minutes hint that the Fed may ease monetary policies by 50 basis points next month.
Key Price Levels:
Resistance Levels: 1.3100, 1.3200, 1.3400
Support Levels: 1.3000, 1.2800, 1.2600

GBPUSD May Step Lower
Price movement in the GBPUSD daily market continues to consolidate sideways at the 1.3043 support level. This price level is positioned significantly below the middle Bollinger Band. A recent green price candle has contracted significantly, indicating that downward pressure is strong.
At the same time, the Stochastic Relative Strength Index (Stochastic RSI) is in the oversold region. The indicator lines are dragging sideways, suggesting that bearish forces remain active in the market.

The GBPUSD Market Has a Bearish Focus
Moving to the GBPUSD 4-hour chart reveals that the market has the potential to offer additional gains to bearish traders. Although the last price candle is positioned just above the middle Bollinger Band, the red candle indicates a bearish session.
Additionally, the Stochastic RSI indicator has already delivered a bearish crossover in the overbought region. The subsequent lines of this indicator have a downward trajectory, with the leading line already breaching the 80 mark. Therefore, the market has considerable potential to descend lower, possibly breaking through the 1.3000 support level and heading toward the 1.2950 threshold.
Do you want to take your trading to the next level? Join the best platform for that here.


Leave a Reply