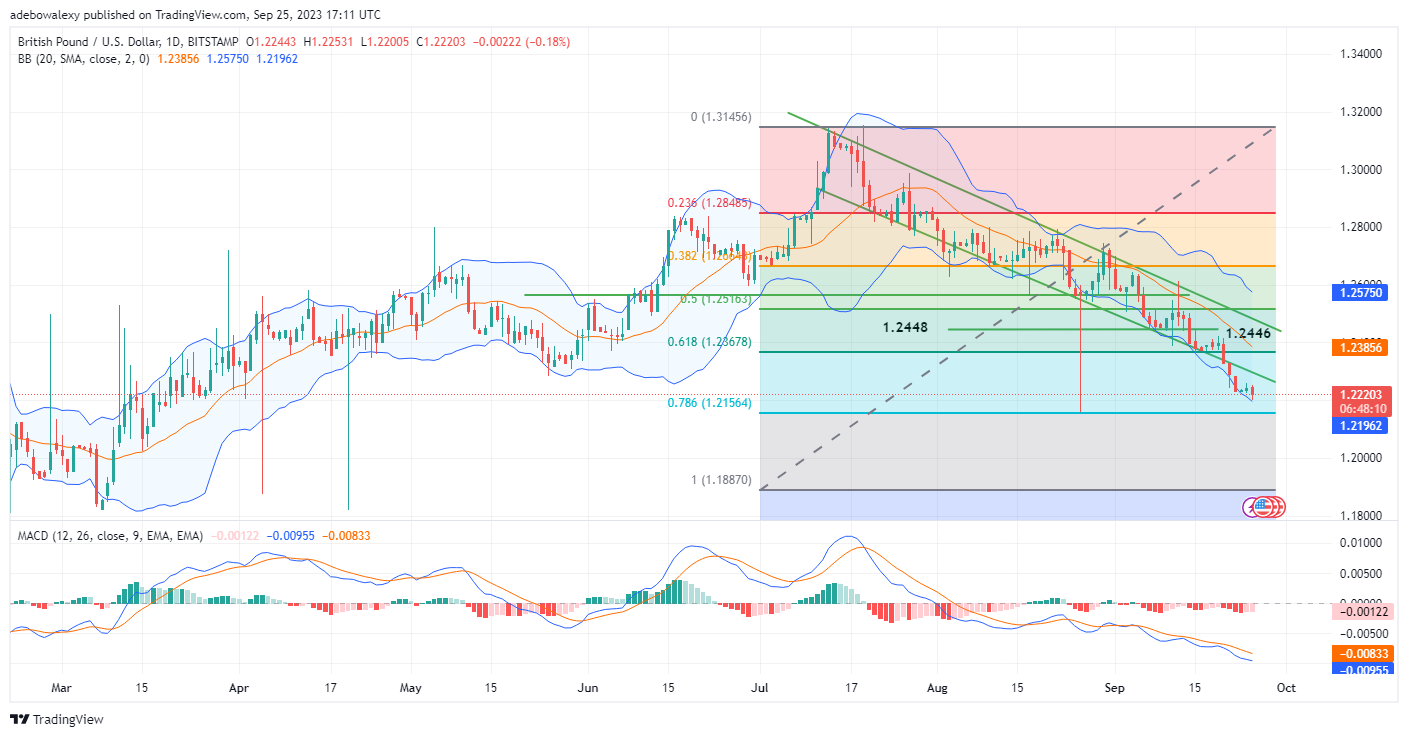
Price activity in the GBPUSD market has stayed consistent with the downward path picked by the pair on the 21st of this month (September 2023). The pound appears to have gone weaker over the weekend, and its performance today seems to promise more gains for bear traders in this market.
Major Price Levels:
Resistance Levels: 1.2250, 0.6456, and 0.6500
Support Levels: 1.2220, 1.2200, and 1.2250

GBPUSD Extends a Downward Correction Towards the 1.2200 Mark
During the previous week, price action in the GBPUSD market seemed to have increased in downward momentum. This could be perceived as price action in this market breaking through the floor of the downward slope price channel that has conveyed previous trading activities in this market.
The ongoing session has shown that price activities may continue on the downward path as the price candle representing it has arrived bearish. However, the Moving Average Convergence Divergence MACD indicator lines continue to trend downward below the equilibrium level, and the bars of this indicator have started appearing pale red. Consequently, this contradicts the present momentum in this market.

Is GBPUSD Preparing a Trend Reversal?
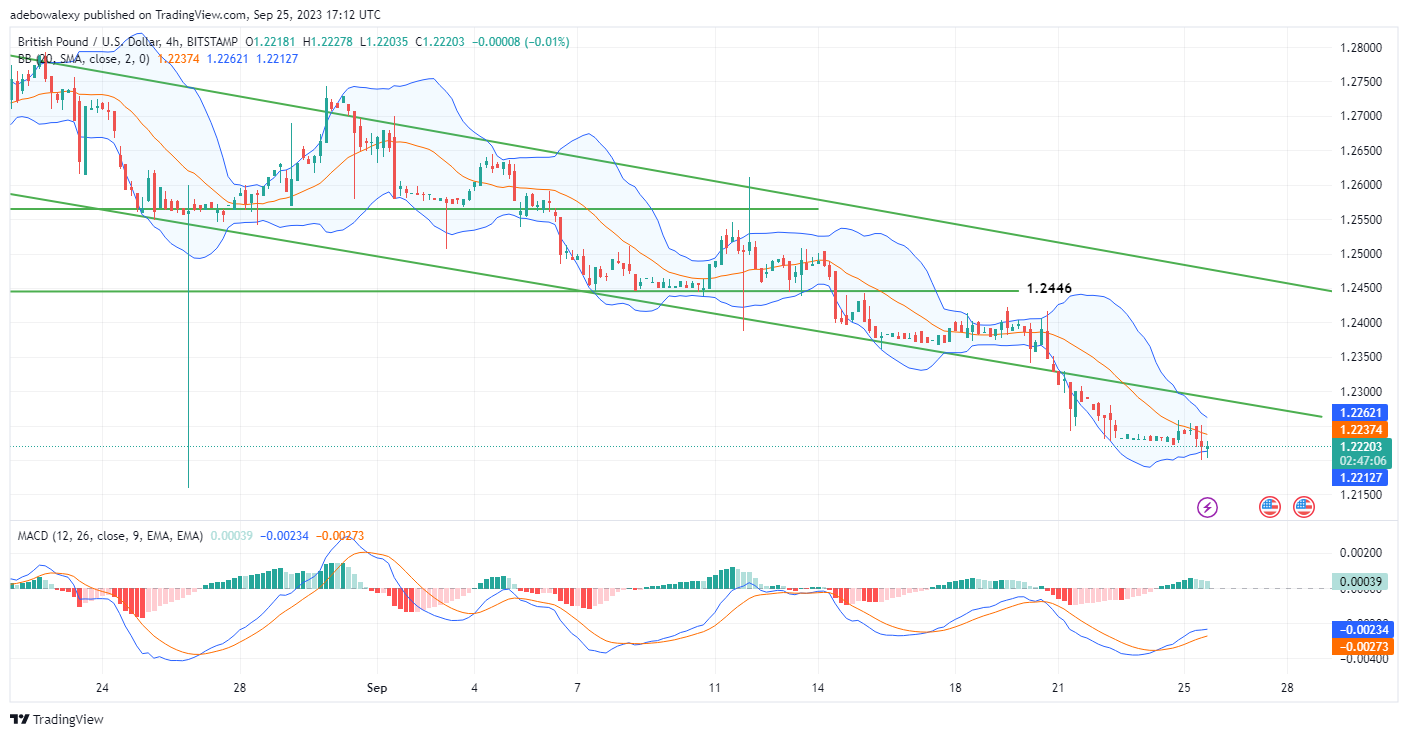
Moving on to the 4-hour GBPUSD market, it could be seen that price action stays mostly bearish at the present. However, the Bollinger Bands indicator is raising suspicion. The suspicion comes from the narrowing of the Bollinger Bands. Nevertheless, only a tiny-bodied price candle has appeared for the ongoing session, below the middle limit of the Bollinger Bands indicator.
Consequently, this shows that bears are still largely at an advantage here. Likewise, the MACD indicator also shows that upside forces are losing momentum even at this point, considering the appearance of the bars of this indicator. As a result, it appears that price action in this market may still be on its way towards the 1.2180 mark.
Do you want to take your trading to the next level? Join the best platform for that here.


Leave a Reply