Firstly I want to say Merry Christmas and Happy New Year to all of you loyal traders and followers who follow this blog regularly. I hope you have had a really great New Year and also had a chance to take a break away from the charts to refresh and spend time with your close family and friends. The New Year holidays when the markets are closed can be a great time to take time out from the charts to refresh, work on trading plans and get ready for the trading year that is to come.

This is my first post back for the year, but the blog will get back to normal now with commentary being posted daily in the Trade Setups section that you can follow after New York close each day. Now that 2015 is here I hope you are ready for a cracking year ahead! If you don’t have your trading plan made up, then you need to get it done as well as your clearly defined goals that you want to achieve in your trading in 2015.
GBPUSD Starts Year With Huge Move lower
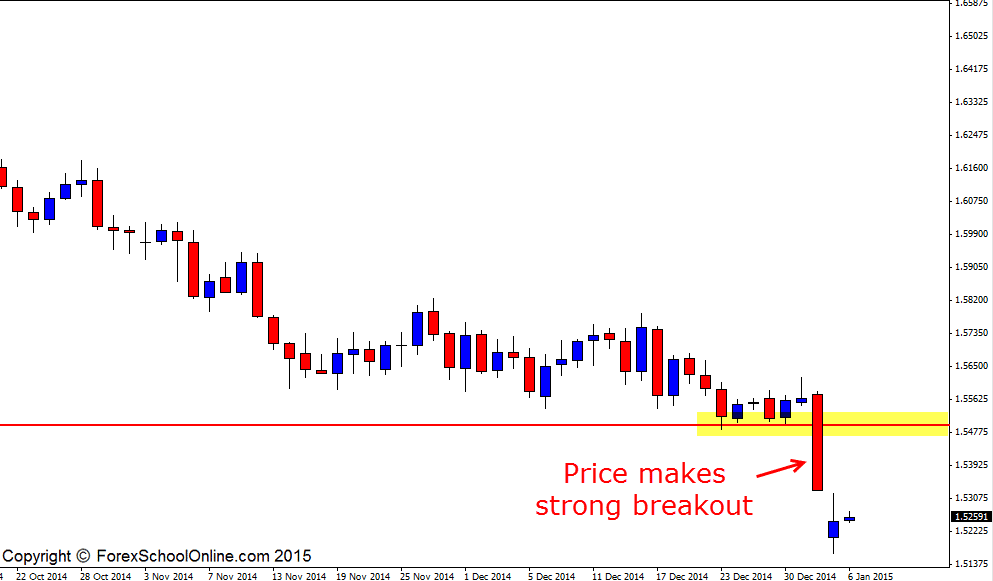
The GBPUSD has started year 2015 by breaking a crucial daily support level and making a large move lower. As the daily chart shows below; this break and move lower was an aggressive move with price closing right near the daily sessions lows. Price at the start of the new trading week also opened lower creating a gap which is not surprising given the momentum behind the large move lower.
The trend is clearly and obviously strongly lower in this market at the moment and with really obvious trends like this we don’t want to fight them or try and pick the low. A lot of traders get themselves into trouble trying to play the “hero” trade by trying to pick the low against the trend. There is no need for this when the really high probability play is to trade with the trend and trade with the strong momentum.
Whilst there are occasions to trade against the trend and sometimes high probability trades will present against the trend, the vast majority of the times; if there is a really obvious trend, then the high probability play is to look to trade within it. The way traders can trade with the trend is by looking to enter setups when price makes pull-backs or rotations back into value areas or swing points. I explain this more in-depth in the trading lesson How Professionals Trade Forex and Hunt Stops
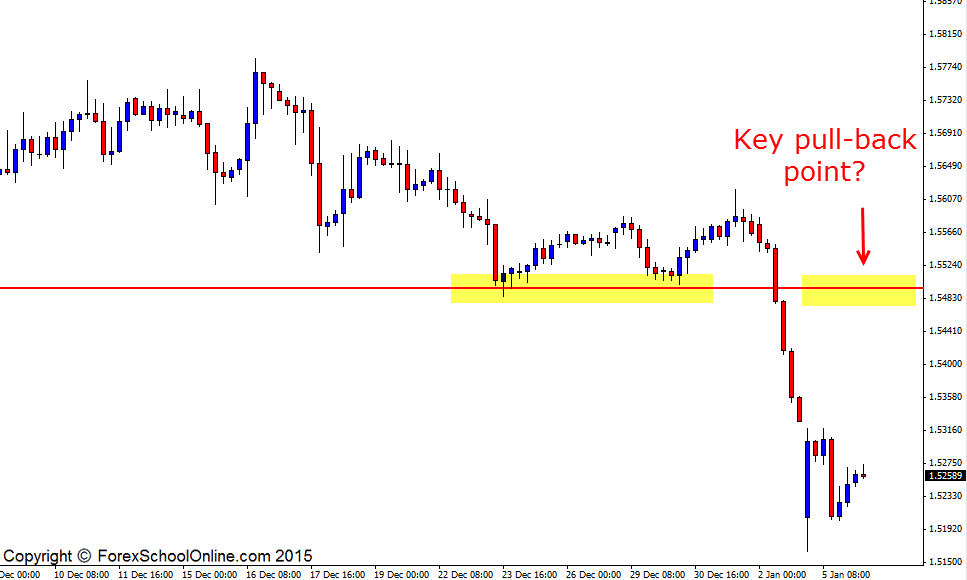
Traders with the GBPUSD could look for price to make a pull-back or rotation back into a value area which as the daily chart shows below; could be around where price previously found support. This area where price found support on the daily chart could flip and look to become a new resistance area and this could then become a high probability area for traders to hunt short trades. Short trades could be hunted on either daily or intraday charts such as the 4 hour time frame like the 4 hour chart shows below.
GBPUSD Daily Chart

GBPUSD 4 Hour Chart


Leave a Reply