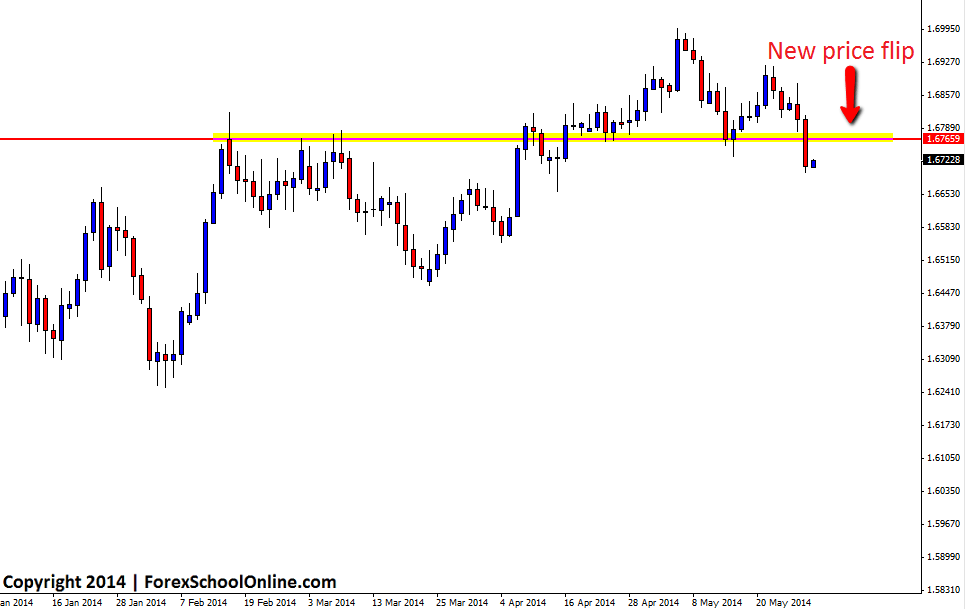
The GBPUSD has smashed through a key support price flip level on the daily price action chart. Price in recent times has been trading strongly higher, with price making solid higher highs and higher lows, but in yesterdays session price made a clear break through the daily support level and importantly closed below.
This key support level could prove crucial to where price goes in the coming days and weeks for this pair. Should this old support level hold as a price flip level and a new resistance level, price may make a new leg lower. If price pops back above this level and this move below turns to be a quick false break of the support, then price may hold back above the key level.
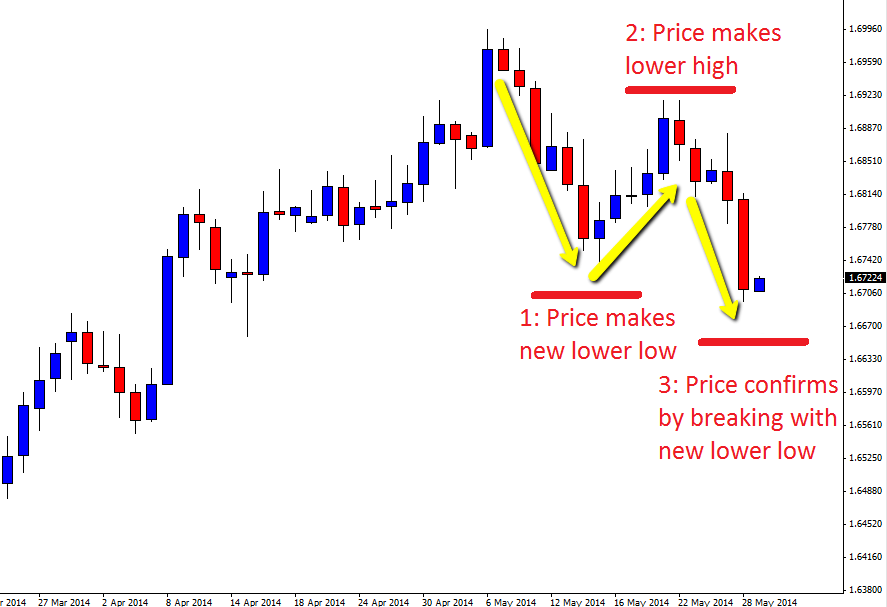
What is interesting to note is that from the recent highs, price has formed a 1,2,3 trend reversal pattern with price making a lower high and now breaking to confirm that 1,2,3 with the new lower low. The 1,2,3 reversal pattern is normally a short term price action trend reversal,. indicating that price is looking to change the short term trend. You can read more about how the 1,2,3 works in the Forex trading tutorial How to Trend Trade Price Action |In-depth Tutorial
If this new price action flip level holds, traders could look to hunt for high probability price action trading signals such as the ones taught in the Forex School Online Price Action Course. Traders could look for these price action trigger signals on their intraday charts such as their 1hr, 4hr and 8hr charts.
GBPUSD Daily Chart

GBPUSD Daily Chart – Showing 1,2,3 Reversal Pattern


Leave a Reply