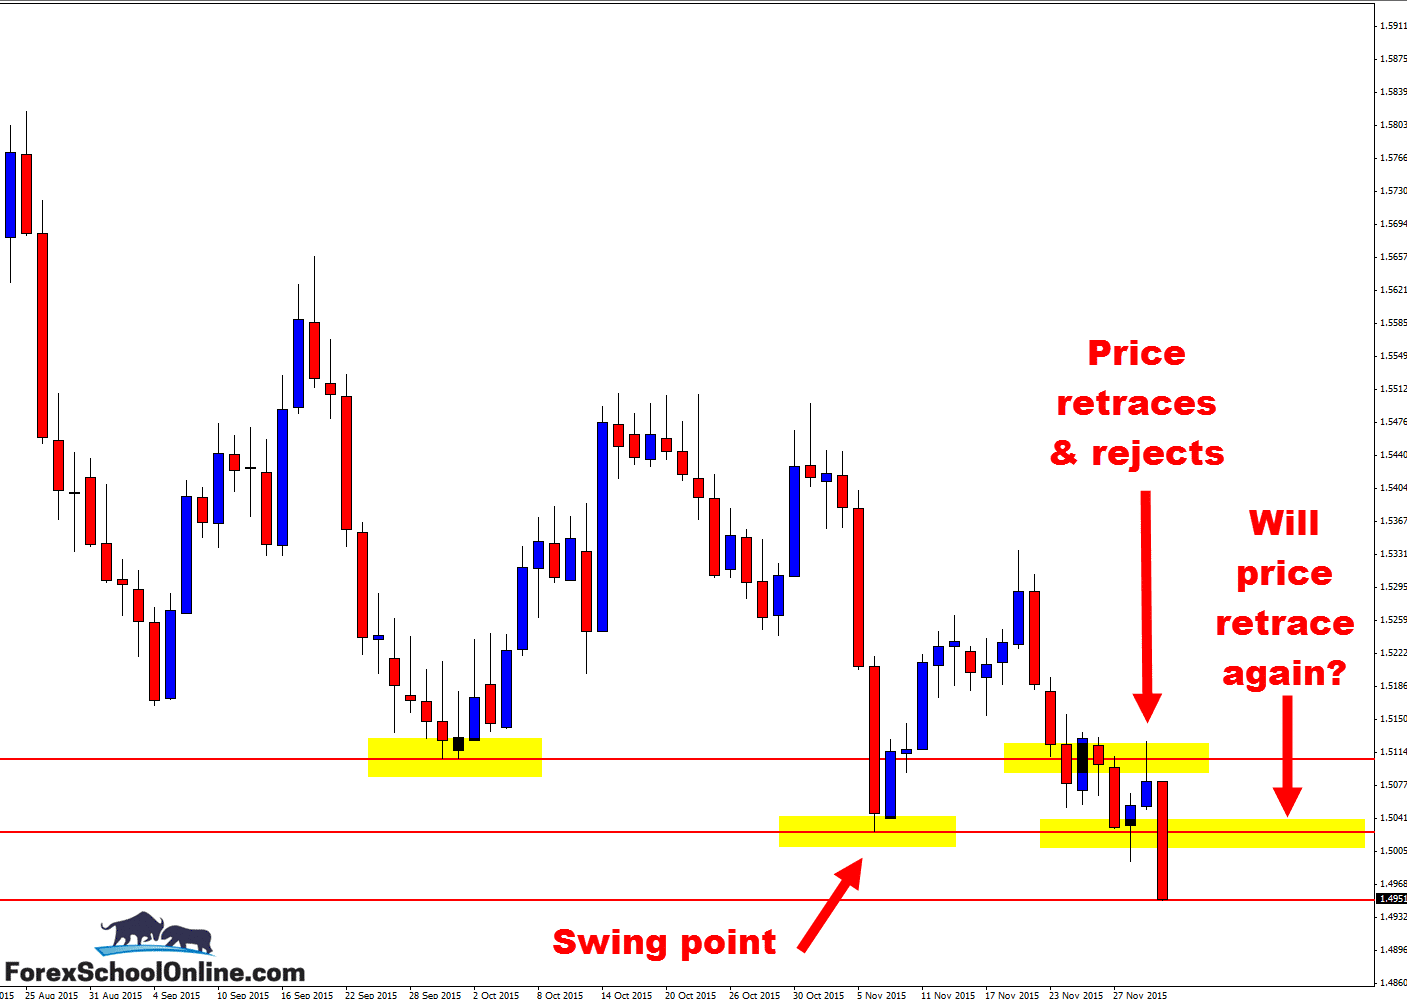
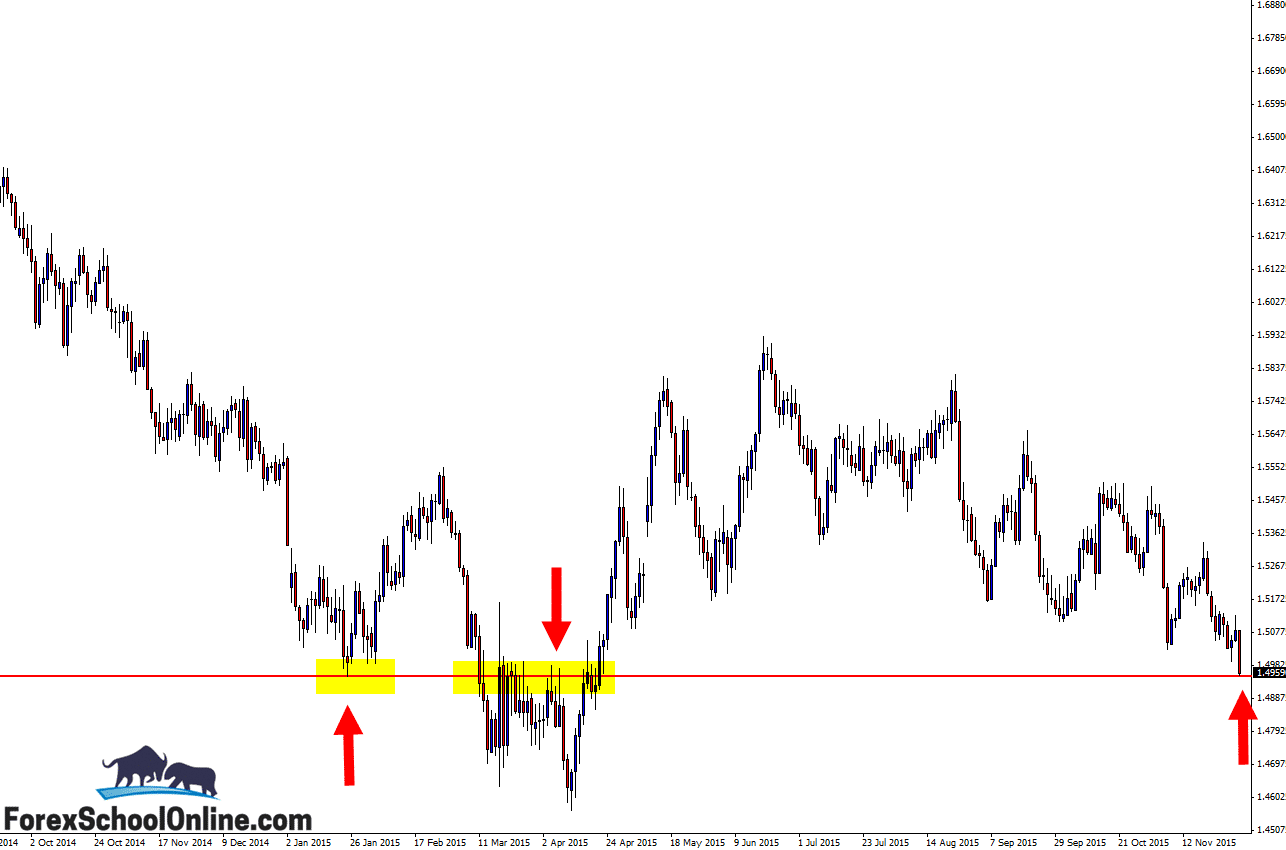
Price on the GBPUSD is sliding lower and into the next near term support level on the daily price action chart as I write this daily Forex commentary. Just in the last few weeks price has been moving heavily lower and has broken through two important swing points and support levels as the daily charts show below;
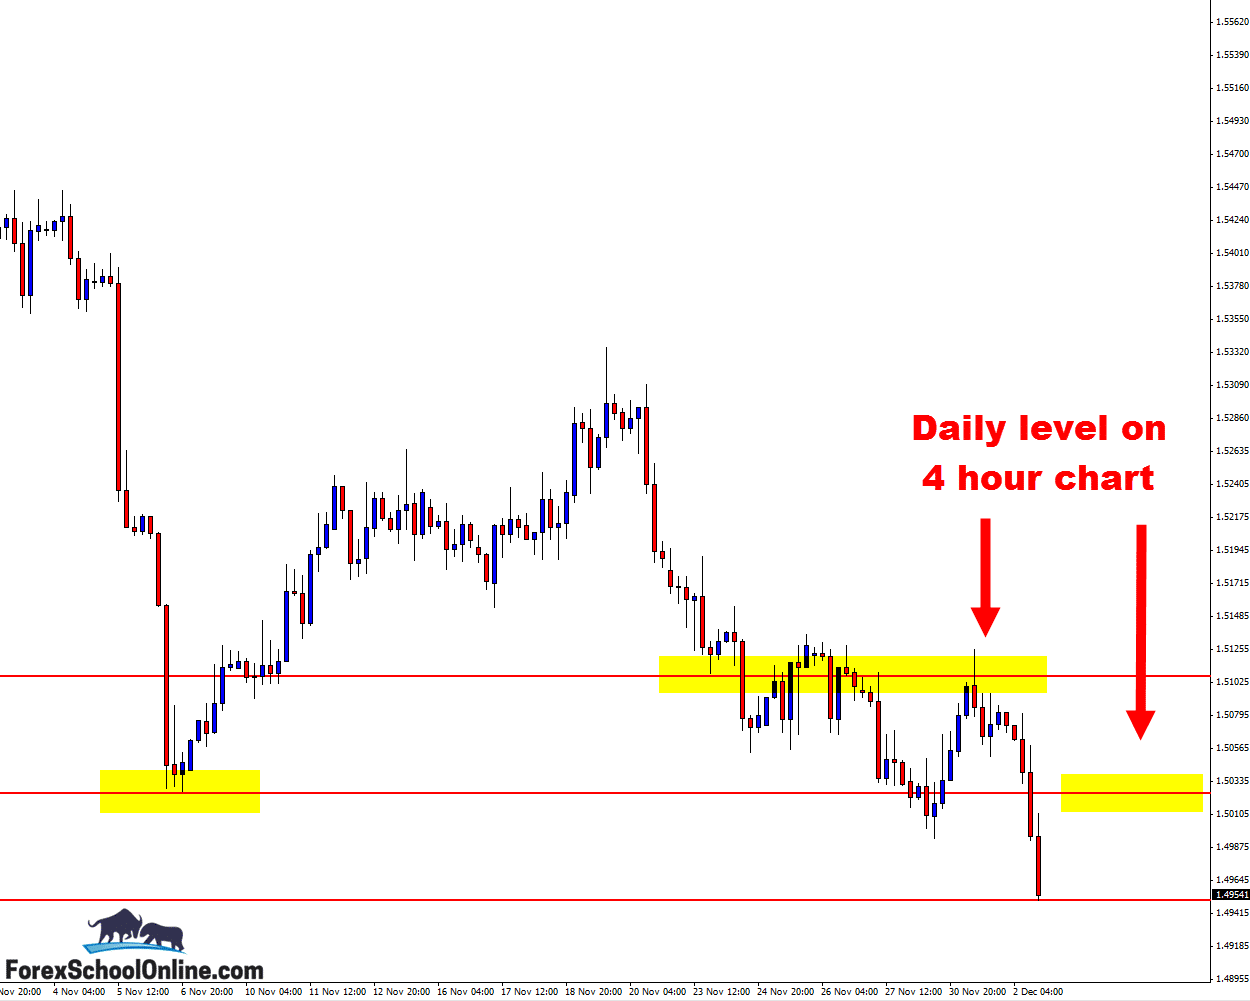
As price often does after busting out of an important daily level, it made a quick retrace. After breaking lower and through the old support level, price made a quick retrace back into the price flip and new resistance level. If you look at the 4 hour chart below you will see that this is where price moved higher and found resistance at the swing high.
These quick retrace setups where price is testing a level that has very recently been broken can be super high probability trade setups because not only are the trades being taken from really solid levels, but very often they are also trading with the recent strong momentum on the intraday charts.
This market could throw up another potential trading opportunity very similar to the retrace that has just passed. Price has just now broken another support level that could once again act as an old support and potential new price flip resistance area.
I discuss how these market rules tend to be repeated and can be learned by traders to their advantage in the trading lessons; The Price Action Guide to How Price Moves
You can watch this level for a very similar type of trade setup, looking for price to make a quick retrace back higher and then to hunt short trade setups. For any potential trades you would need to see an A+ high probability trigger signal such as the ones taught in the Members Only Price Action Course.
Daily Chart – Price Breaking Major Daily Levels
Daily Chart – Price Moving Into Next Support Level
4 Hour Chart – Retrace, Will it Happen Again?


Leave a Reply