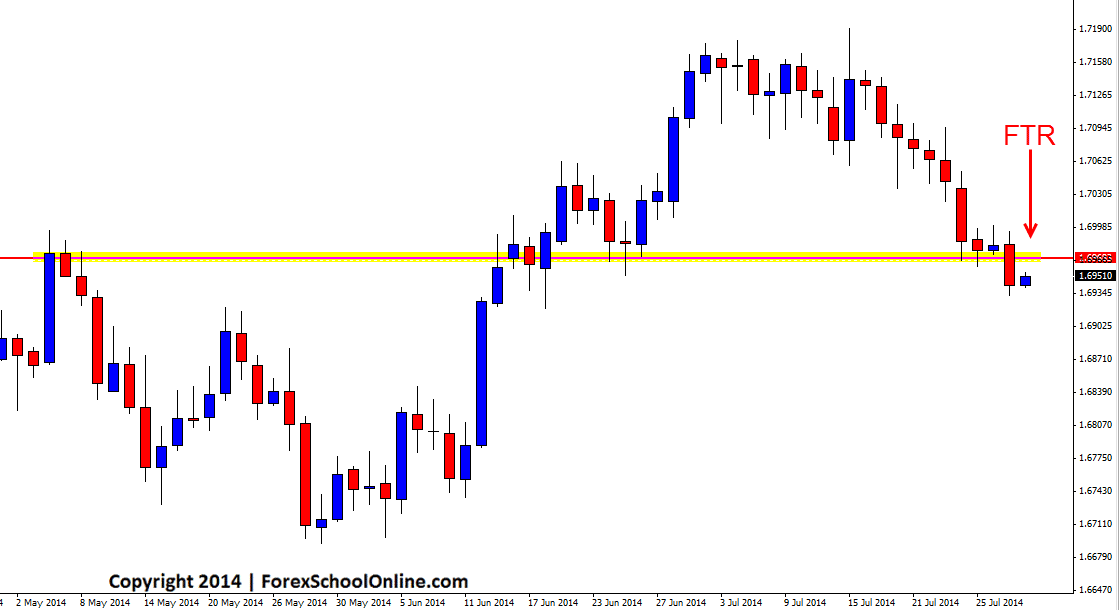
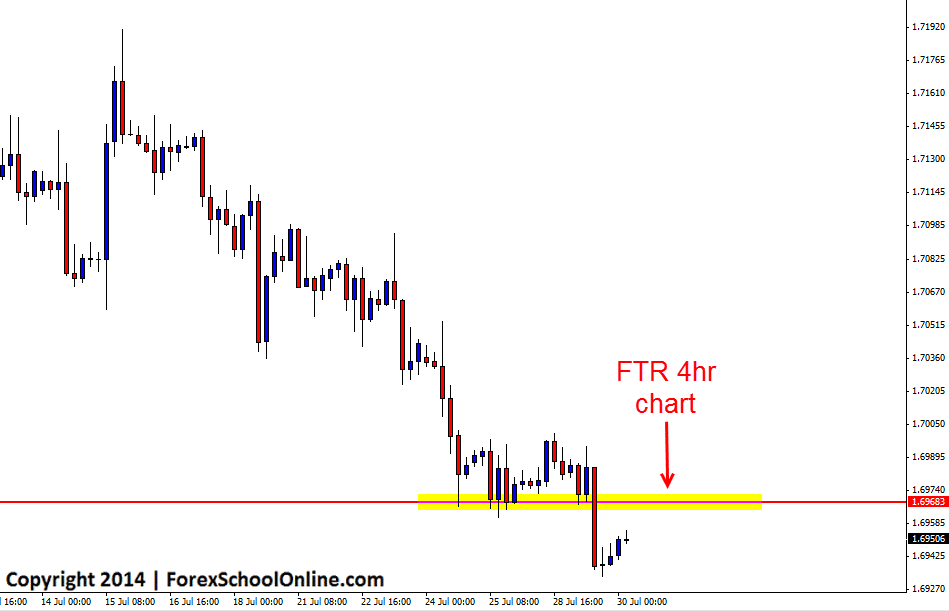
The GBPUSD has recently broken through a support level on the daily price action chart and importantly closed below at this stage. As the 4hr chart shows below; price was stalling above this solid support level, but as is common when price makes a break through a key level, when the break occurred it was fast and aggressive.
If price now retraces back higher and into the old daily support level, it could present as a potential price flip level and possible opportunity for traders to target short trades at the First Test Resistance (FTR) level like I discuss in the trading lesson Targeting High Probability Trades at the First Test Resistance/Support. Traders could look for bearish price action trigger signals on the intraday charts such as the 4hr or 1hr to see if price action is going to reject this new resistance of if price wants to move back above the resistance.
Trading a bearish rejection reversal trigger signal at this First Test Resistance (FTR) on either the 4hr chart or 1hr chart would be trading a reversal at a swing high in-line with the strong recent down-trend. Traders will need to watch this level closely for price action clues if price does retrace back higher because for any potential trades to be placed, a high probability price action setup is needed such as the ones taught in the Forex School Online Price Action Courses.
GBPUSD Daily Chart

GBPUSD 4hr Chart

Related Forex Trading Articles & Videos
– Targeting High Probability Trades at the First Test Resistance/Support


Leave a Reply