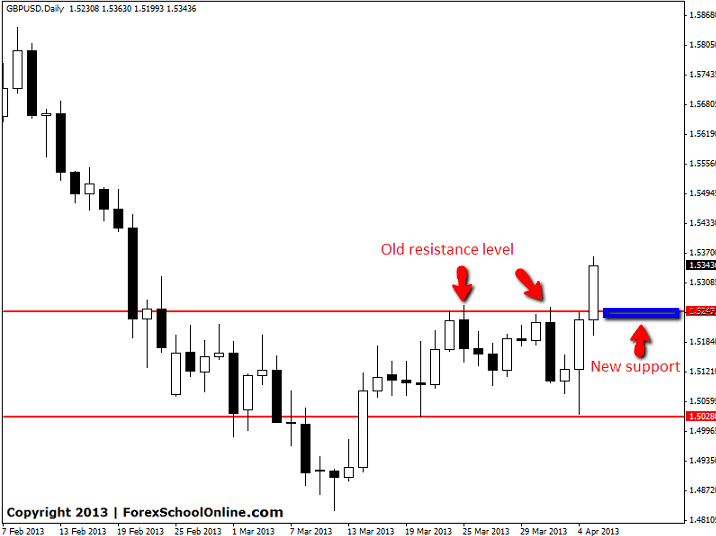
The GBPUSD looks to have now formed a base, with price at the end of last week bouncing higher to close well off the weekly lows. The bulls grabbed full control over price towards the end of the week on the daily chart and pushed price substantially higher. During the move higher, price smashed through the key resistance level that has been containing price in recent times.
Now price has moved higher and through the resistance level, it could look to get a move on and continue with the new short term trend higher. If price is to rotate back lower before continuing, the old resistance area could act as a new support. This new support zone could provide a solid level for price action traders looking to trade with the short term trend in their favour. Price has formed a 1,2,3 reversal pattern that could be the starting point for price to move higher. To learn more about trading with the trend and how to spot the 1,2,3 reversal pattern read here: Trend Trading Forex Price Action | In Depth Tutorial
The chart below shows this support level that traders could look to target for long trading opportunities. This level is now shaping to be critical for price over the coming days and weeks. If this support level fails and price moves back lower, the overall long-term down-trend could continue with much lower prices. The next support levels for this pair come in around 1.5025 and then.4870.
GBPUSD DAILY PRICE ACTION CHART | 7TH APRIL 2013


Leave a Reply