Market bulls in the GBPUSD market appear to be gradually losing steam. Recently, price action received an upside boost, which saw price action bounce off important support. At this point, signs of weakness have started showing up in GBP/USD price movements. Therefore, it is necessary to further investigate price movements in this market.
Major Price Levels:
Top Levels: 1.2419, 1.2469, and 0.1.2519
Floor Levels: 1.2400, 1.2370, and 1.2335

GBPUSD Bulls Seem to be Losing Dominance
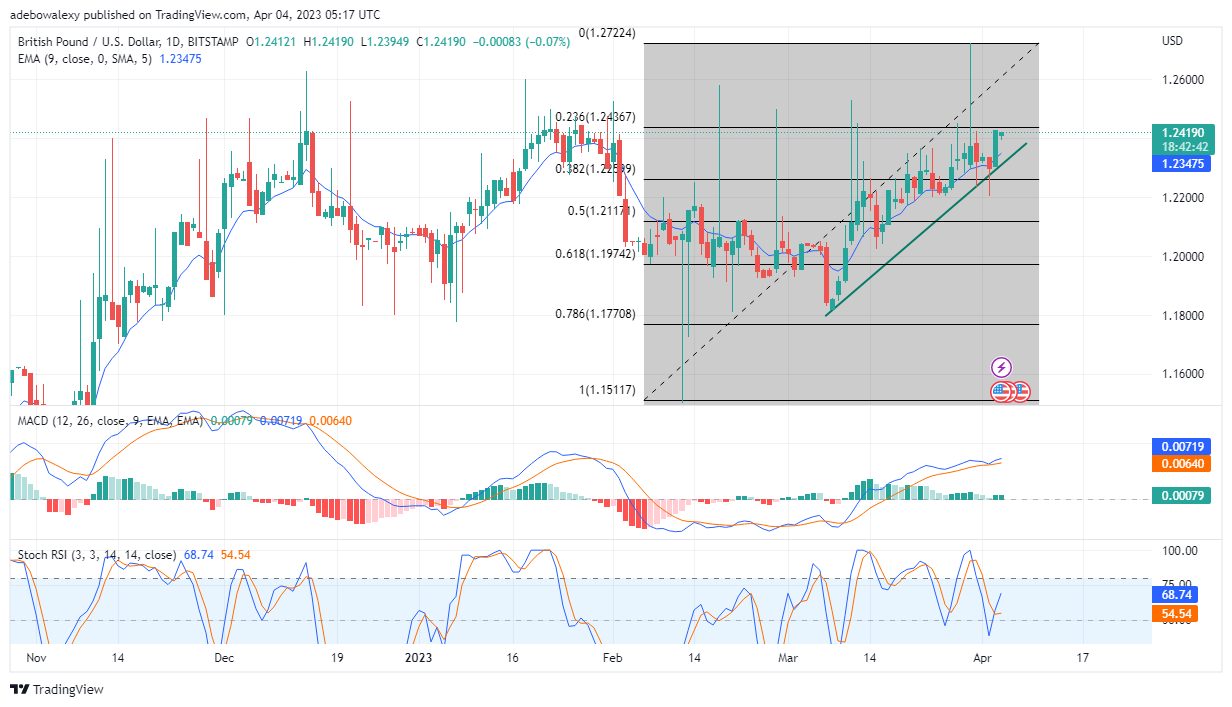
In the GBPUSD daily market, price action has ramped up considerably in the previous session. However, looking at the ongoing session, it could be seen that upside forces have lost a significant amount of strength. This could be seen in the last price candle for this as it is both smaller and its close part is lower than the one for the previous trading session. Nevertheless, the Moving Average Convergence Divergence (MACD) indicator shows that bulls are still alive, as the bars of this indicator are green. Likewise, the RSI indicator has displayed a bullish crossover. However, carefully observing the lines of this indicator, one will notice that the crossover seems to be lacking a clear direction.

GBPUSD Struggles to Remain Afloat
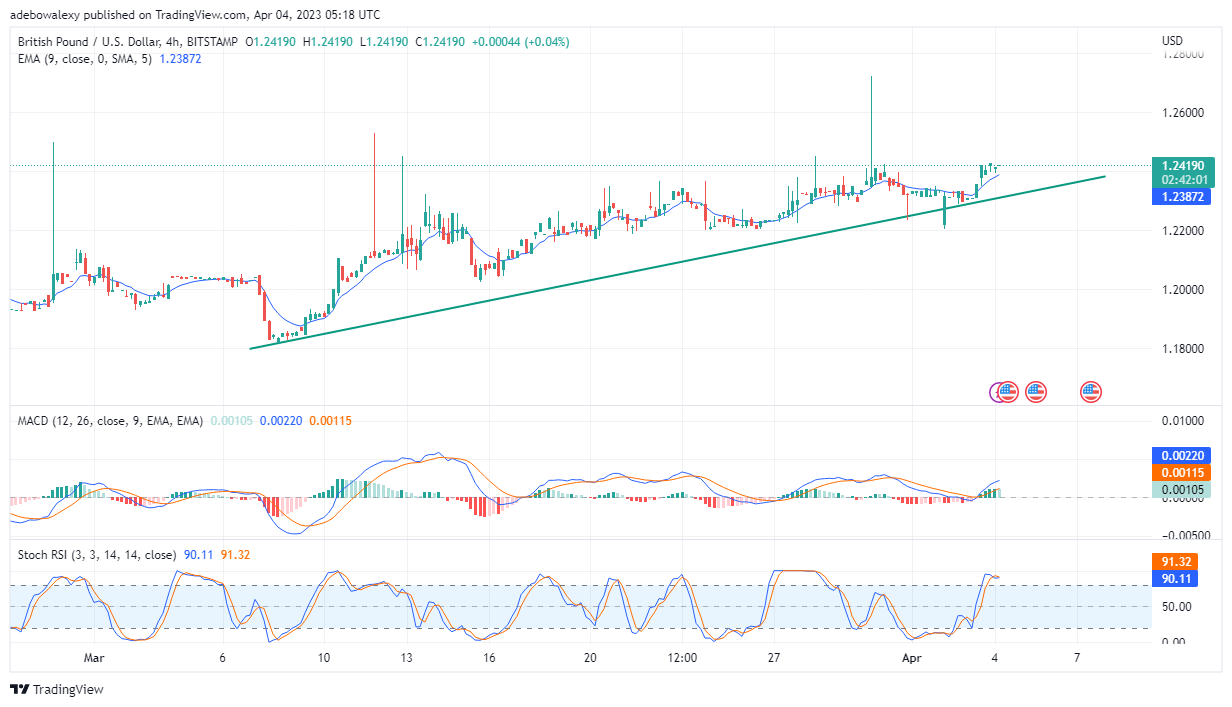
On the four-hour GBPUSD market, tiny-bodied price candles can be seen scattered above the 9-day Exponential Moving Average (EMA) curve. Also, the last price candle here is a dashed-shaped price candle, which suggests a lack of direction in price movement. Nevertheless, the MACD curves remain above the equilibrium level, but its bars are now pale green to indicate a slowing upside momentum. The RSI curves are clearly in the overbought region, but their lines seem to be converging for a bearish crossover. Therefore, traders can anticipate the GBPUSD price falling to the 1.2380 mark soon.
Do you want to take your trading to the next level? Join the best platform for that here.


Leave a Reply