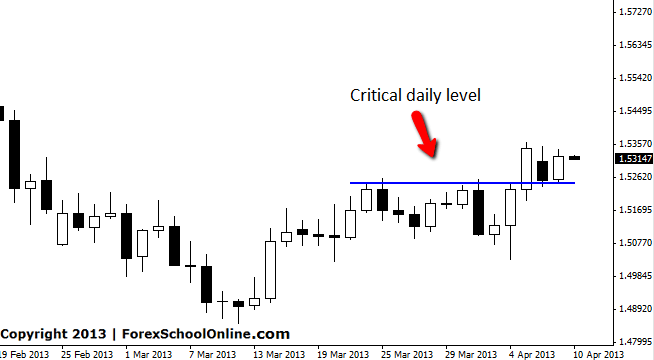
In a previous post in this blog we recently discussed the GBPUSD and how it has broken the critical resistance level that could look to act as an important support level for price to continue moving higher. To read that post see here: GBPUSD Set for Break Higher
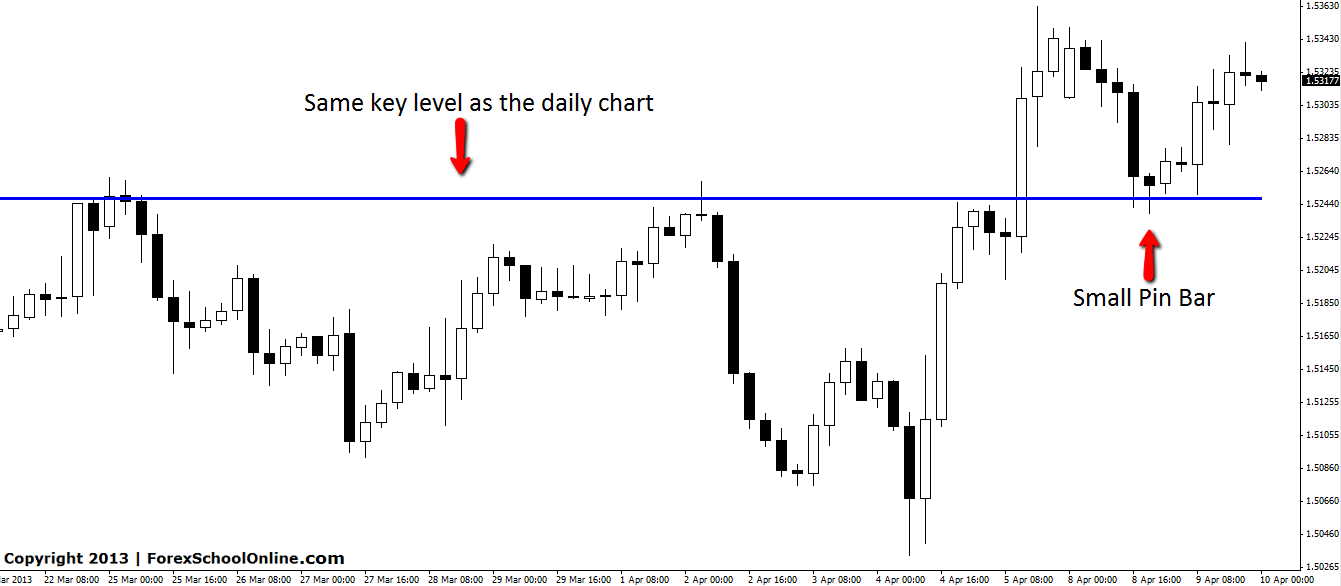
Since making that post price has moved lower into the support level highlighted in the post above, at which point support held for price to move back higher. Traders that targeted this level to look for bullish price action to get long would have seen a small Pin Bar on the 4hr chart.
This Pin Bar rejecting the critical support level was very small, but because of how solid the level was, it still proved as the turning point for price to continue on higher.
GBPUSD DAILY CHART | 9TH APRIL 2013

GBPUSD 4HR CHART


Leave a Reply